Author: lewisjalove

  • A Guide to Using a Checklist in Slack for Flawless Workflows

    A Guide to Using a Checklist in Slack for Flawless Workflows

    You have two primary ways to create a checklist in Slack. For quick, one-off tasks, use Slack’s built-in tools like formatted messages or the Workflow Builder. But to manage complex, repeatable processes that require automation and tracking, you need a specialized third-party app.

    Why Your Team Needs Checklists in Slack

    A series of chat messages transforming into a structured checklist titled 'No missed steps' with items checked.

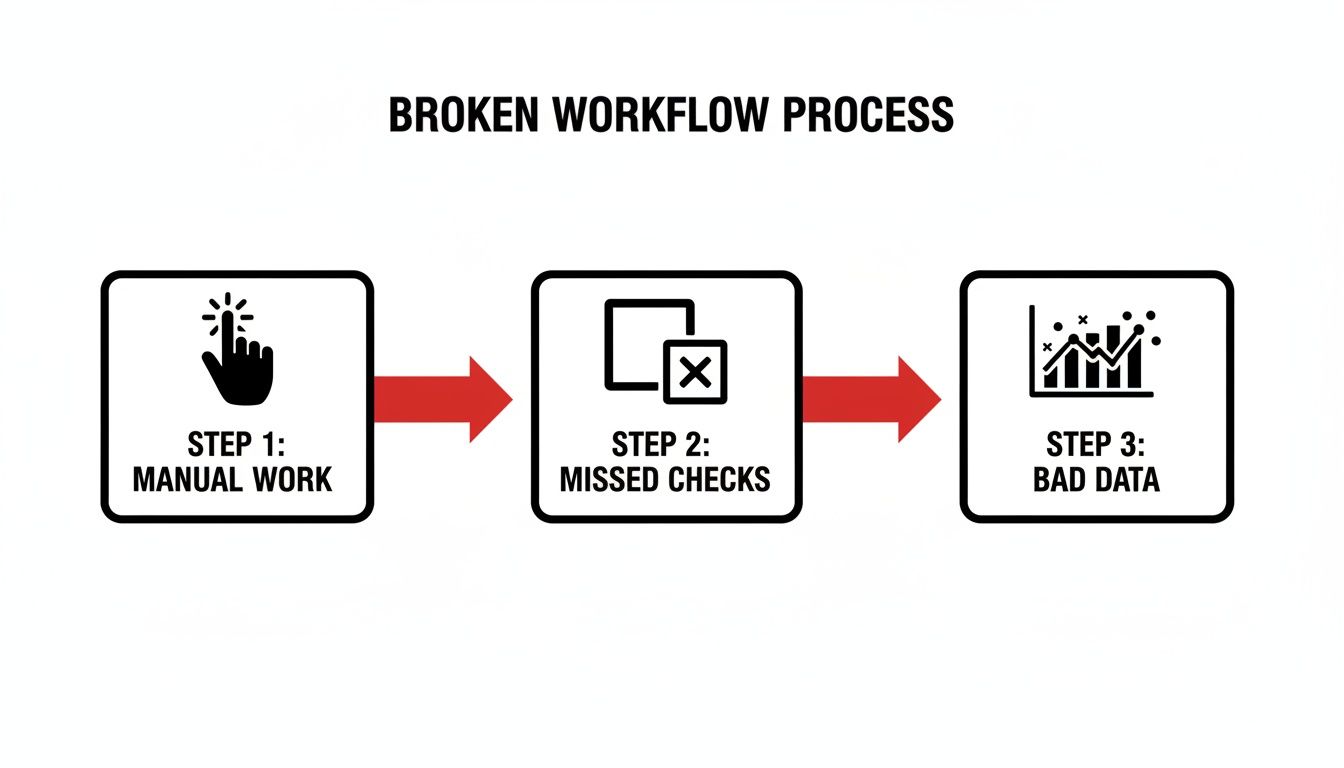
    Slack is where your team communicates, but it’s a terrible place to track tasks. A critical to-do item mentioned in a busy channel can get buried under new messages in minutes. You've been there, scrolling endlessly to find who was supposed to do what.

    This chaos creates bottlenecks, especially during critical handoffs. Imagine a developer pushing code to QA. Without a defined process, you're stuck with manual pings, copied-and-pasted messages, and constant follow-ups just to confirm basic steps were completed. That back-and-forth eats up valuable time and introduces risk.

    From Chaotic Chat to Structured Workflow

    Implementing a checklist in Slack transforms your communication hub into an actionable workflow engine. Instead of relying on memory or digging through conversations, you create a clear, visible plan right where your team works.

    This one change solves several common problems:

    • Eliminate Guesswork: A checklist clearly defines every step and assigns an owner. There’s no confusion about who is responsible for what.
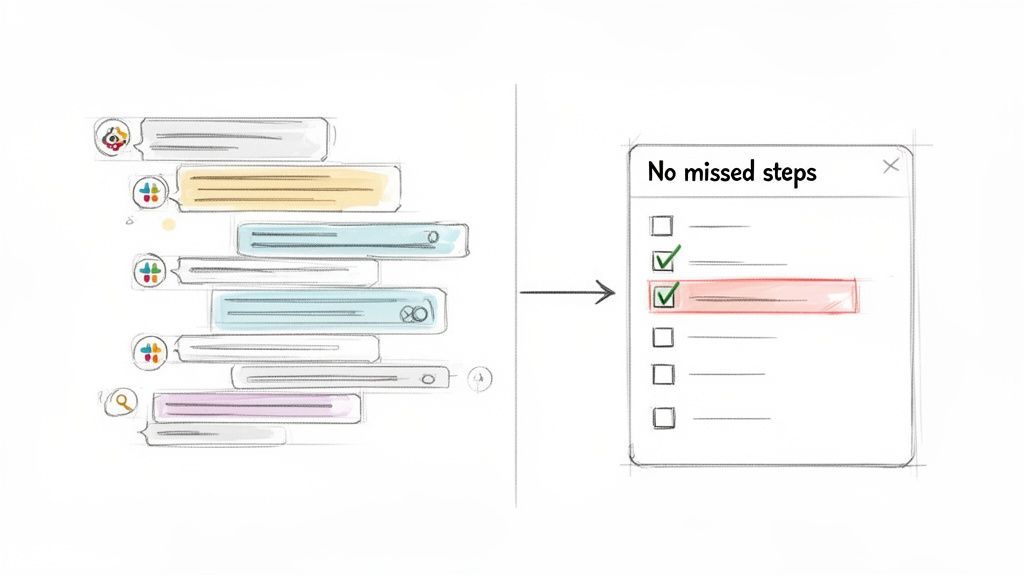
    • Prevent Missed Steps: For complex processes like software deployments or new employee onboarding, a checklist acts as a safety net. It guarantees no critical step is forgotten.
    • Reduce "Just Checking In" Messages: When everyone can see real-time progress on a shared checklist, the need for status updates disappears. Your team can focus on their work.
    • Create a Clear Audit Trail: A completed checklist serves as a permanent record, proving that every required step in a process was completed correctly.

    By structuring key processes inside Slack, you unlock true workflow automation. These checklists are the first step toward building more efficient, self-managing systems.

    Actionable Insight: A good checklist doesn't just list tasks; it enforces a standard. Use it to ensure every deployment, QA handoff, and client onboarding follows the exact same high-quality process, every single time. This consistency is the foundation of scalable, reliable operations.

    Ultimately, a checklist brings order to collaborative chaos. If you're just getting started, understanding What Is Slack and Why You Should Use It helps clarify its role as a central hub. From there, it's clear why integrating structured processes like checklists is the logical next step for any team serious about improving their work.

    Before you search for a new app, first master the tools Slack already provides. For many simple, one-off tasks, Slack’s built-in features are surprisingly effective. They require zero setup and are perfect for informal tracking where a full project management system is overkill.

    The most direct way to create a checklist in Slack is by formatting a message. This is the best method for quick, collaborative task lists that don't need to be tracked long-term.

    Simply start typing a message and use Slack's formatting buttons to create a checklist. The key benefit is its simplicity and visibility—everyone in the channel sees the list and can react to items as they are completed.

    The Emoji Reaction Method

    Action Step: Combine a formatted message with emoji reactions to turn a static post into a dynamic to-do list. This gives everyone a clear visual cue for what’s done and what’s not.

    Here’s how a content team can use this for a blog post review:

    1. Post a checklist in the #content-review channel with all review steps.
    2. @mention the proofreader and the designer next to their specific tasks.
    3. As each person finishes their part, they react to their line item with a ✅ emoji.

    This approach works because it keeps the entire process inside the conversation. No new tools, no switching tabs. The status is immediately obvious. The only downside is that these messages can get buried in an active channel, so it's best for short-term tasks.

    Using Slack Reminders for Personal To-Dos

    For your own tasks, use Slack's /remind command to create a personal checklist that pings you or a channel at a specific time.

    For example, a developer preparing for a daily stand-up can set a personal reminder:

    /remind me "1. Pull latest from main. 2. Run unit tests. 3. Update my Jira ticket." at 8:45am every weekday

    Slackbot will send this list via DM every morning, ensuring nothing is missed before the meeting. It's an effective way to manage recurring personal tasks without cluttering a public channel.

    Actionable Insight: The main advantage of Slack's native tools is their immediacy. You can create, assign, and track a simple checklist in seconds without leaving the chat window. Use this for the fast, fluid nature of daily work.

    Basic Automation with Workflow Builder

    For repeatable processes that need more structure, use Slack’s Workflow Builder. This tool lets you create simple, automated actions triggered by a user clicking a link or using an emoji reaction.

    To create a basic content approval process, build a workflow that starts when a writer adds a 📝 emoji to their message containing a draft link.

    • Trigger: User reacts with the 📝 emoji.
    • Action 1: An automated message appears in the #editors channel, showing the original message and a "Begin Review" button.
    • Action 2: An editor clicks the button, and a checklist is automatically posted in a thread for them to follow.

    This creates a consistent process that guides the next steps without manual intervention. It’s a great first step into automation, showing how a simple checklist in Slack can become the foundation of an organized system.

    Leveling Up with Third-Party Checklist Apps

    Native Slack tools are great for quick, informal tasks, but they have clear limitations when your processes become more complex.

    For recurring workflows, tasks that need persistent tracking, or anything that requires an audit trail, you need a dedicated third-party app. These tools turn your Slack workspace from a simple communication tool into a command center for your projects.

    These apps are built to solve the problems that native features can't. Messages get buried, and automated follow-ups are non-existent. A dedicated app brings structure and accountability into your channels, ensuring a critical checklist in Slack gets done, not just posted.

    Choosing the Right Tool for Your Team

    To pick the right tool, you need to evaluate your team's specific needs. A good starting point is to explore some of the cool Slack apps to transform your workflow. But to make a final decision, ask these questions:

    • Team Size and Complexity: Does your small team have straightforward projects? A simple task manager will work. Is your large engineering department running multiple sprints? You need a robust tool with deep integrations.
    • Process Repetition: Do you run the same process over and over, like new employee onboarding or weekly deployments? Choose an app that lets you create and reuse templates to save time and ensure consistency.
    • Need for Automation: Do you need tasks to be automatically assigned to the next person? Do you need automatic reminders for deadlines? If so, look for apps with strong automation features.

    Actionable Insight: The key advantage of a third-party app is its persistence. A simple message gets lost in a busy channel. A dedicated checklist app gives you a permanent, trackable record of work that lives alongside your team's conversations.

    Comparing Slack Checklist Methods

    To help you decide, here is a direct comparison of your options.

    Method Best For Key Features Limitations
    Native Slack Features Quick, one-off tasks; personal to-do lists; simple reminders. Free and built-in; easy to use for anyone in Slack. No templates; easily lost in channels; no audit trail; limited automation.
    Dedicated Checklist Apps Recurring processes; cross-functional workflows; tasks needing audit trails. Reusable templates; progress tracking; deep integrations; advanced automation. Often requires a paid subscription; can have a learning curve.

    Ultimately, adopting a third-party app is about overcoming the limitations of Slack's native tools. When you need a persistent, automated, and auditable checklist in Slack, a dedicated app is essential for maintaining momentum and quality as your team grows.

    For engineering and DevOps teams, the best results come when your Slack checklists are perfectly synced with Jira, your single source of truth. This is where generic apps fall short and specialized tools like Nesty excel. They are designed to bridge the gap between fast-paced Slack conversations and the structured, auditable processes you manage in Jira.

    The goal is to eliminate context switching. No one wants to finish a task and then remember to jump over to Jira to update the ticket. The two systems should function as one, creating a seamless flow where progress is instantly visible everywhere it matters.

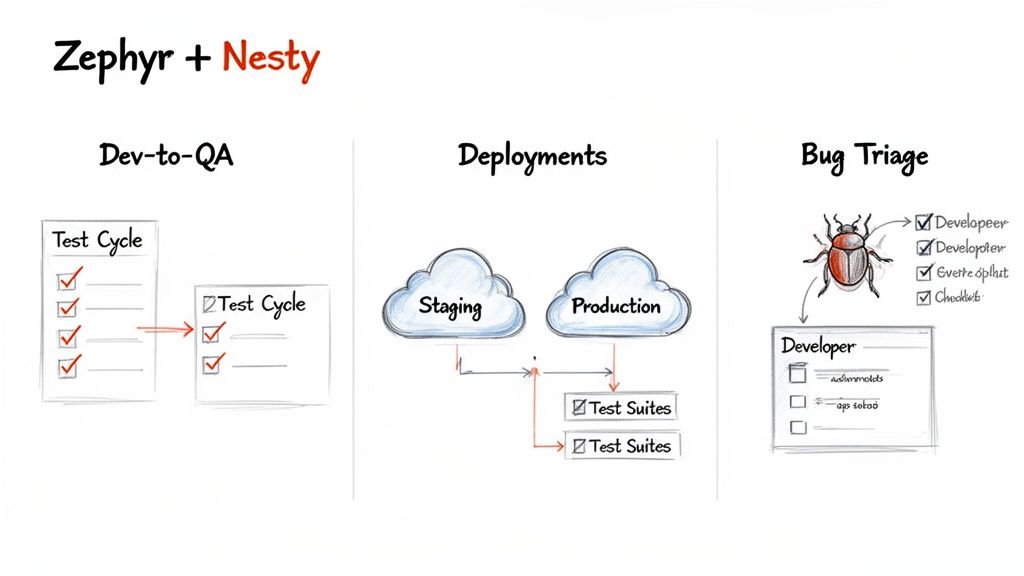
    A Practical Example: The Dev-to-QA Handoff

    Here is a step-by-step walkthrough of a high-stakes scenario where this integration is critical: the handoff from a developer to the QA team. First, install the Nesty app in both Jira and Slack to link the two platforms.

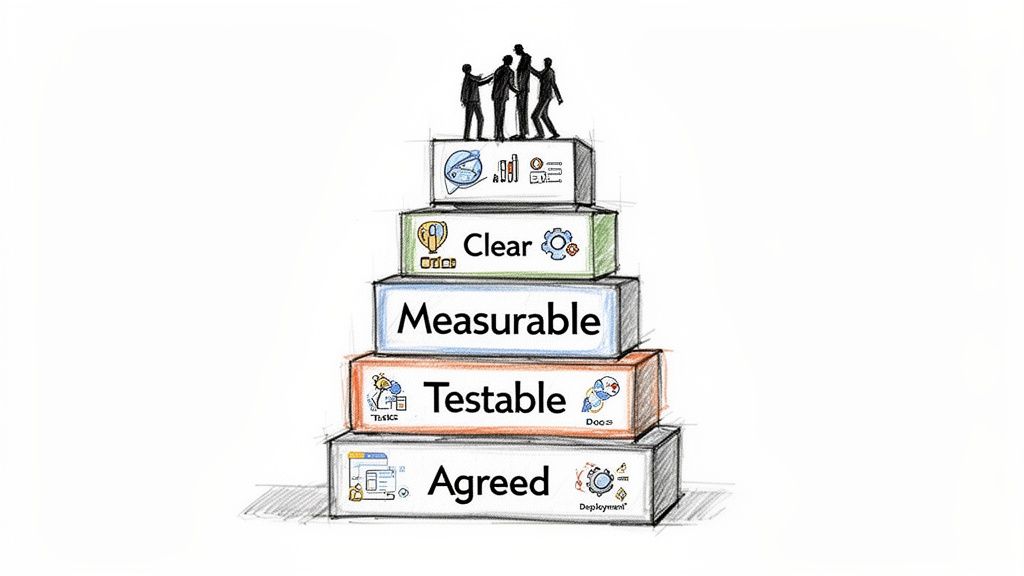
    Next, build your automated workflow. A powerful starting point is to set up a "Definition of Done" (DoD) checklist in Jira. This isn't just a list; it becomes a mandatory gate that a ticket must pass before it can be moved to the QA column.

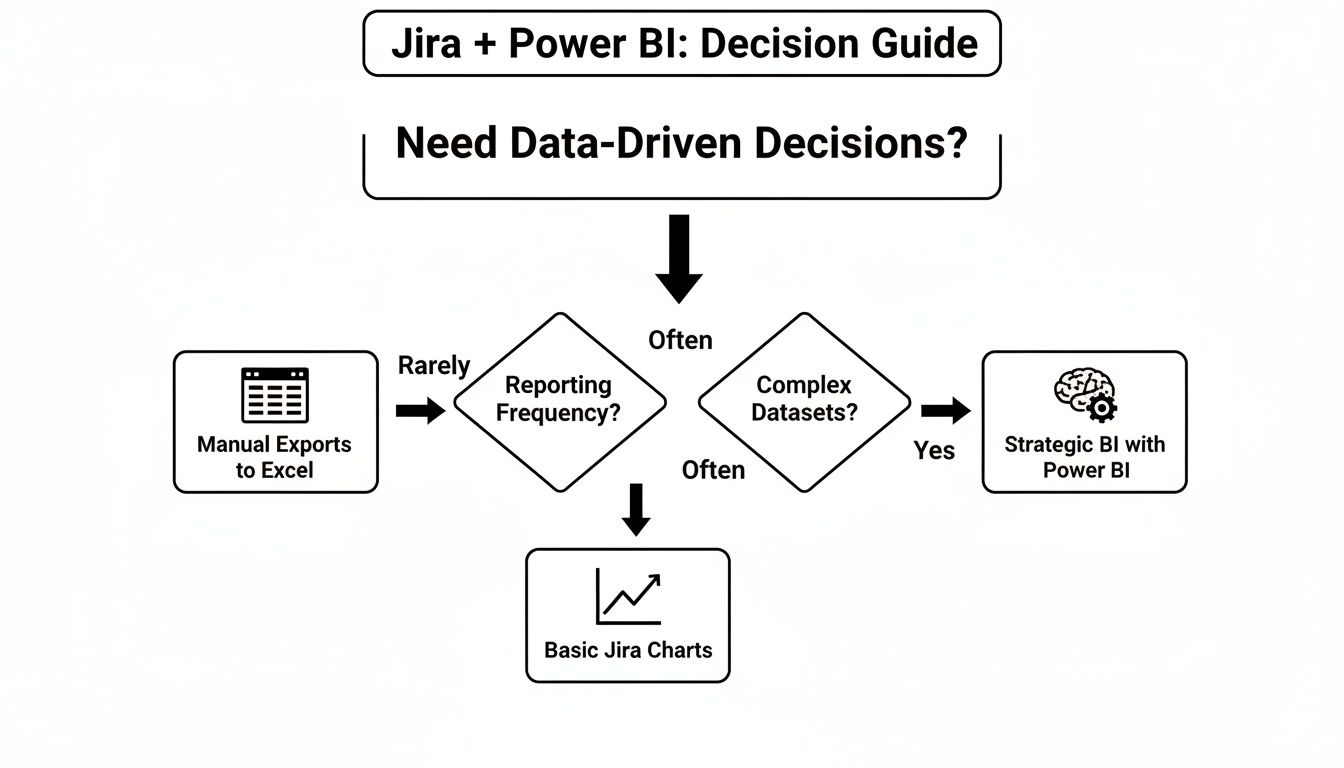
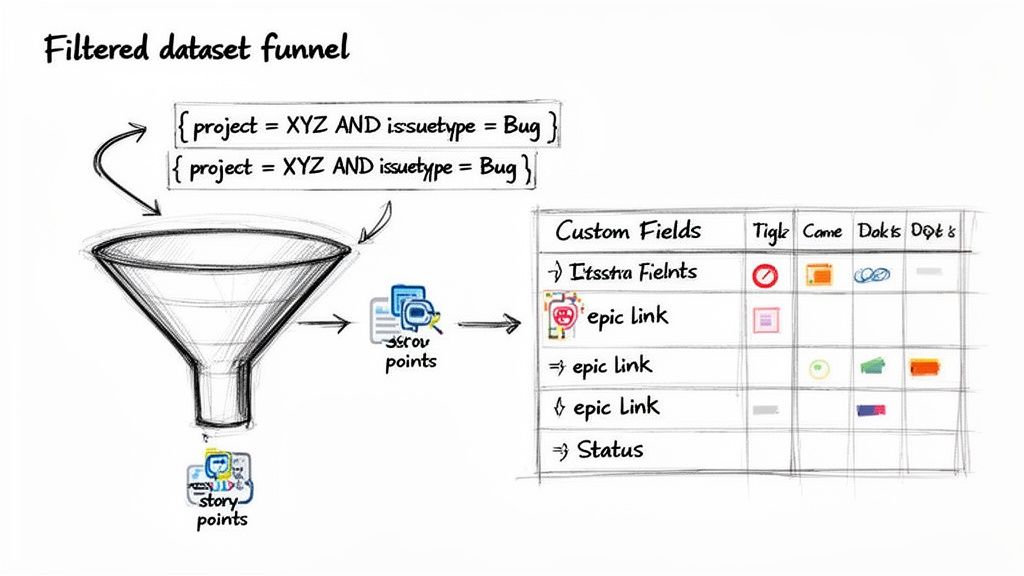
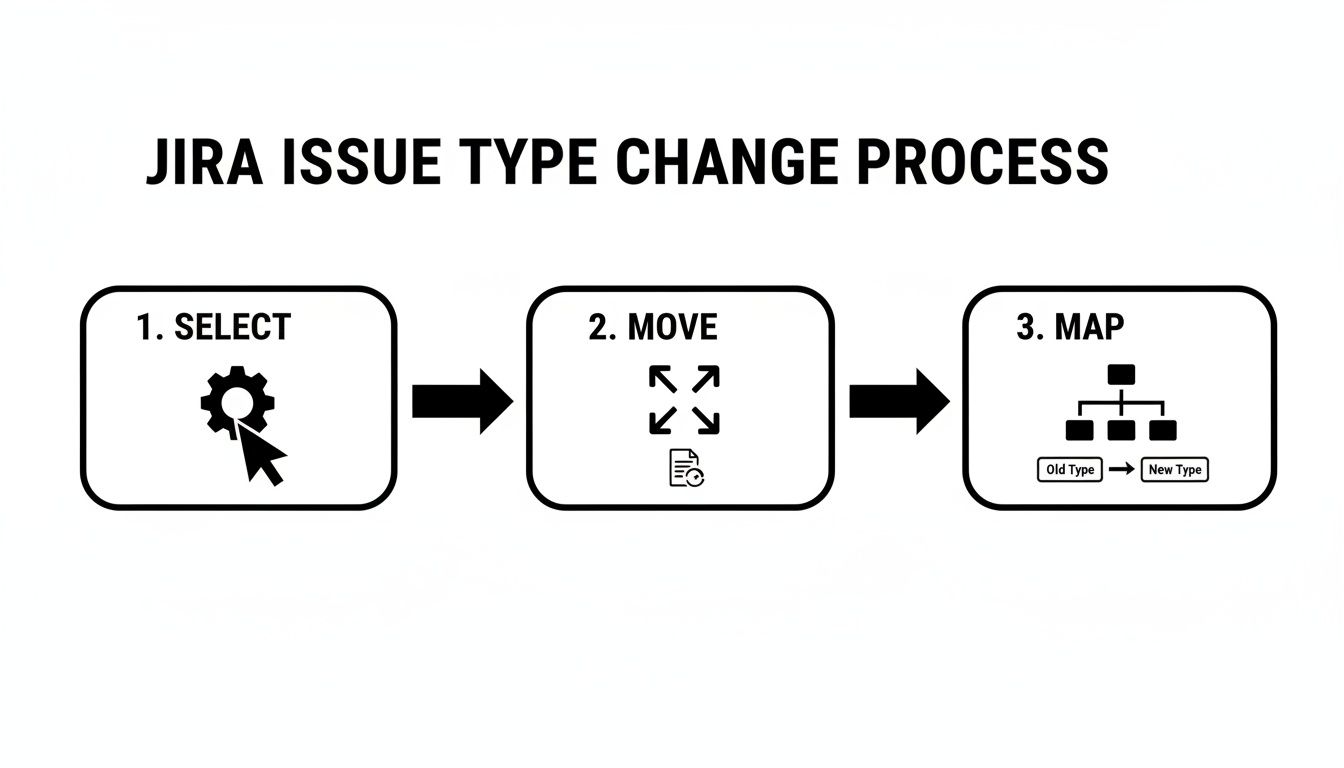
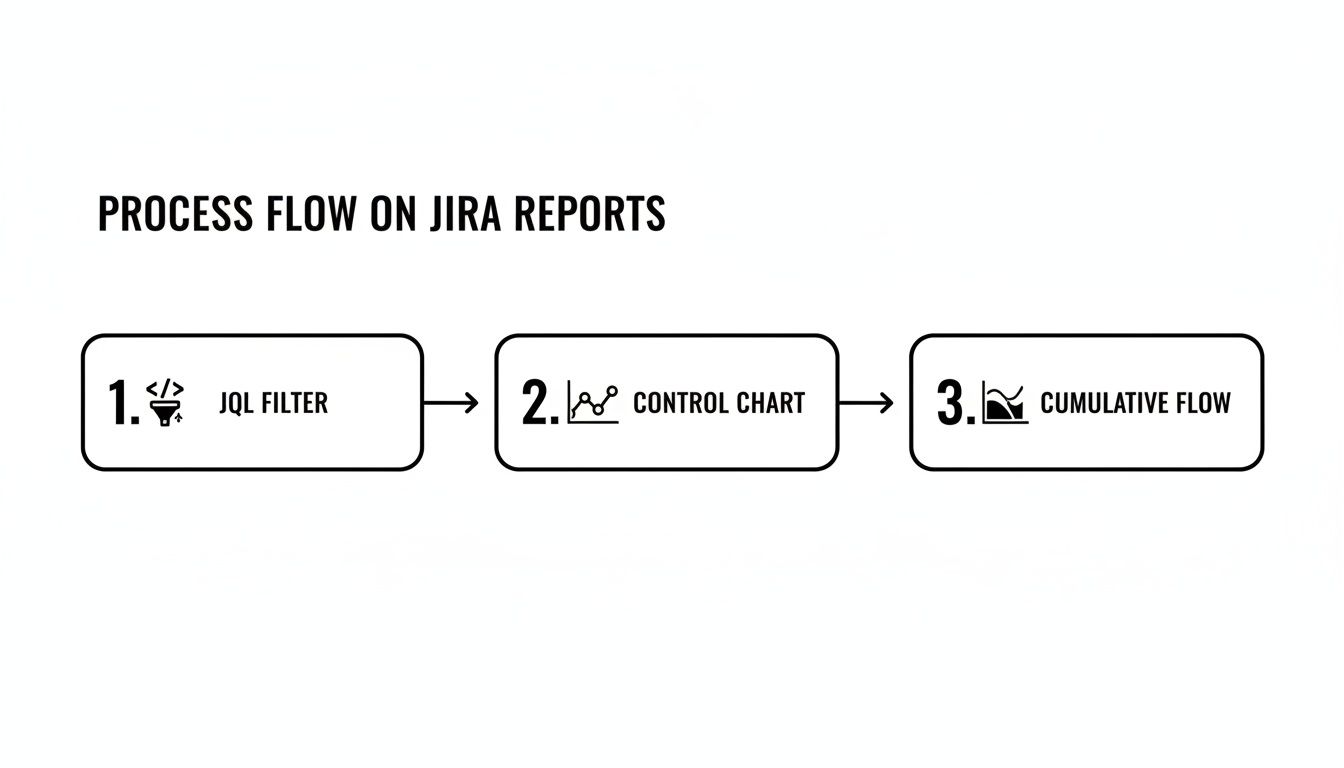
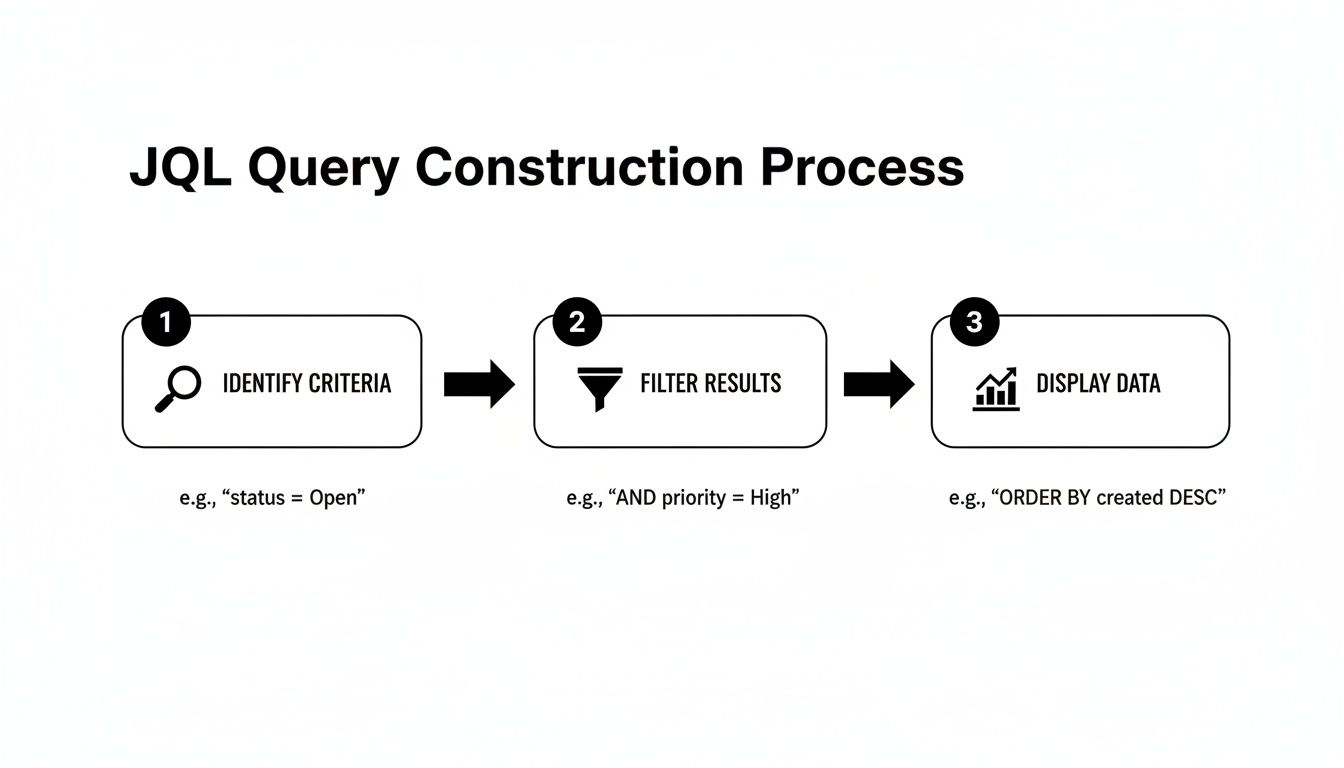
    This diagram shows how teams evolve from basic Slack features toward more powerful, integrated solutions.

    A diagram illustrates the Slack checklist process flow, moving from native Slack to third-party apps and ultimately to checklist completion.

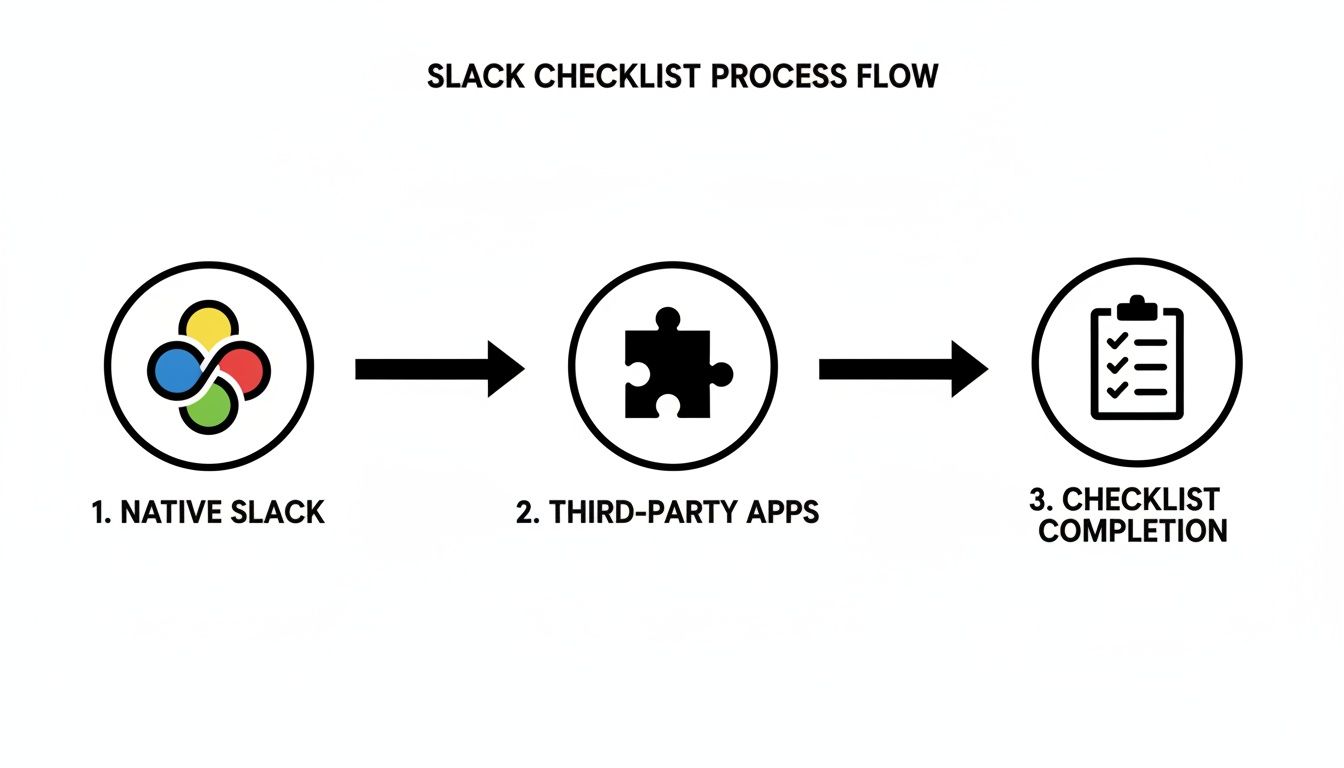
    As you can see, the path is about maturing from simple message-based lists to fully automated workflows that connect your tools for maximum efficiency.

    Here’s how to execute the Dev-to-QA handoff:

    1. Trigger the Checklist in Jira: A developer drags a ticket to the "Ready for QA" status. This action automatically adds your pre-built DoD checklist to the Jira issue via Nesty.
    2. Notify the QA Team in Slack: Simultaneously, a message appears in the #qa-team Slack channel. It links directly to the Jira ticket and displays the new checklist.
    3. Keep Everything in Sync: As the developer checks off items in Jira—like "Unit tests passed"—the corresponding item in the Slack message is instantly checked off. No manual updates are needed.
    4. Automate the Handoff: Once the final item on the DoD checklist is complete, the automation takes over. The Jira ticket can be automatically reassigned to the QA lead, and a final "Ready for testing!" notification is posted in Slack.

    This creates a transparent validation gate. The QA team doesn't have to ask if the prerequisites are done. They see the completed checklist in Slack and know the ticket is ready for them.

    To get deeper into building these structured lists inside Jira, refer to our full guide on how to create a checklist in Jira.

    Why Is This Integrated Approach So Powerful?

    This tight integration tackles the "coordination overhead" that slows down even the best teams. By 2019, Slack already had over 12 million daily active users, a number projected to hit 79 million monthly users by 2026. At that scale, even small inefficiencies become major problems.

    According to recent Slack usage statistics, teams that embed Slack into their core workflows send 32% fewer emails and get products to market 23% faster. But without structure, speed can lead to chaos. For any team that relies on Jira, pulling checklists into both platforms aligns fast-moving conversations with your source of truth, reducing context switching and ensuring every step is accounted for and auditable.

    Actionable Insight: Integrating Jira checklists directly into Slack transforms a manual handoff into a self-managing workflow. It's not just about saving time; it's about building quality and predictability into your development lifecycle from the ground up.

    When you connect Jira and Slack this way, you’re not just making another checklist in Slack. You are building an intelligent system that enforces your team's standards, automates repetitive tasks, and gives everyone clear visibility inside the tools they already use all day.

    Best Practices for Slack Checklist Automation

    A hand-drawn diagram illustrating a process flow from DoR to DoD to Assignee, with notification controls.

    Having the right tool is not enough; you must design an effective process. The goal is to build a system that runs itself, keeping everyone aligned without constant manual follow-up.

    Start by designing useful checklists. A 50-item checklist for a minor bug fix will be ignored. Focus on critical validation gates. Identify the absolute must-have steps that prevent larger problems later.

    Enforce Your Standards Automatically

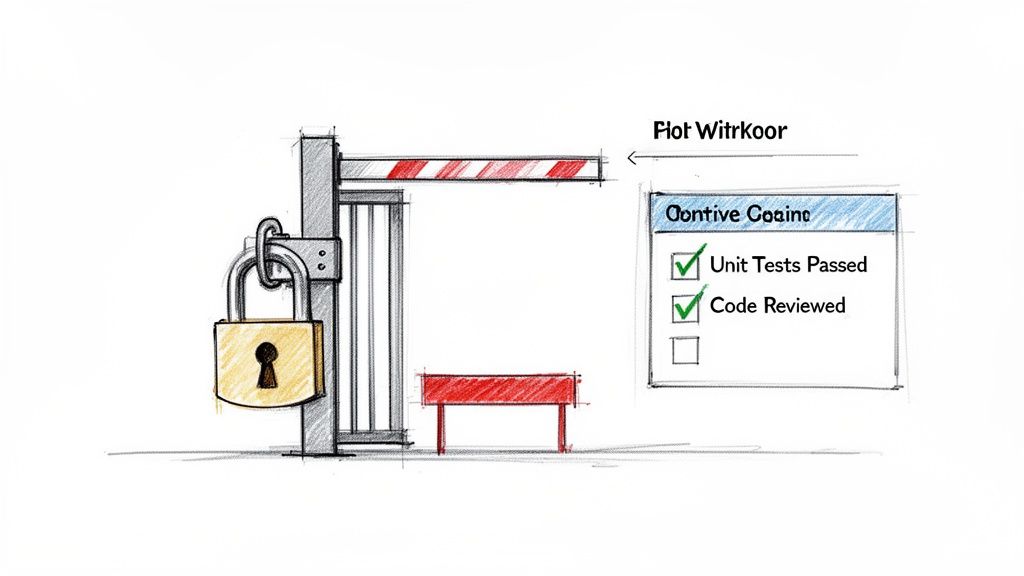
    Here is where you will see the biggest impact. Programmatically enforce your Definition of Ready (DoR) and Definition of Done (DoD). These should not be suggestions on a wiki page; they must be non-negotiable quality gates built directly into your workflow.

    How to implement this: Use an integrated tool like Nesty to set up automation rules that physically block a Jira ticket from moving to the next stage until its associated checklist is complete. For example, make a ticket unable to move to "In Progress" until the DoR checklist is signed off. This one change eliminates a massive amount of back-and-forth communication.

    Actionable Insight: A well-automated checklist acts as your process guardian. It doesn’t just remind people of the rules; it enforces them every time, ensuring every handoff meets the same high standard without requiring manual oversight.

    This is how you eliminate low-value, repetitive work. Slack’s own research found that even though its platform makes users 47% more productive, desk workers still spend about 41% of their time on low-impact tasks. Automating a checklist in Slack that’s connected to your Jira workflow—like enforcing a DoD—is a direct way to reclaim that wasted time by reducing manual status checks and clarification messages.

    Use Smart Triggers for Seamless Handoffs

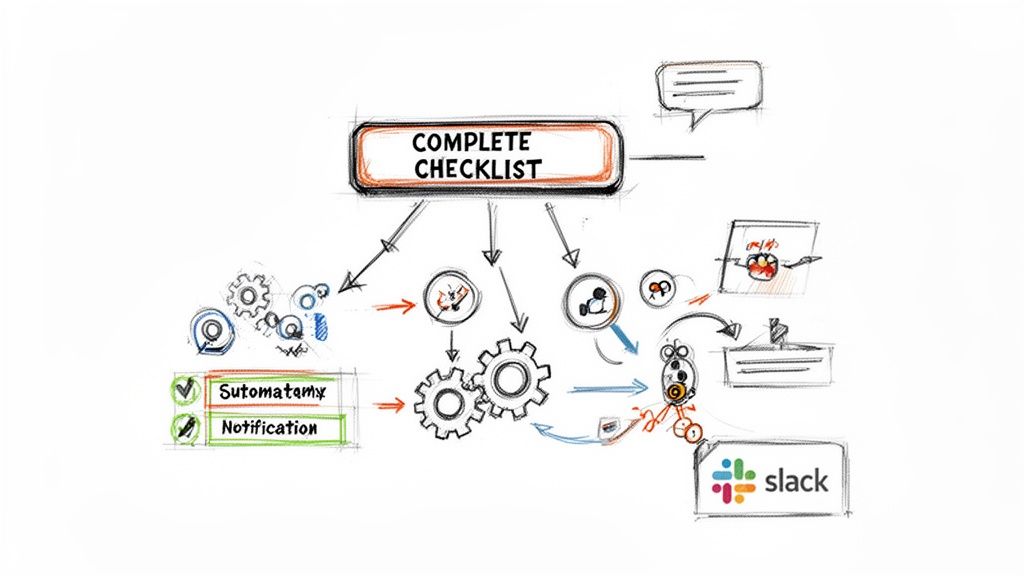
    Automation is most powerful during handoffs between teams. The moment the final item on a "Dev Done" checklist is completed, a chain reaction should occur automatically.

    Use these smart triggers to make handoffs seamless:

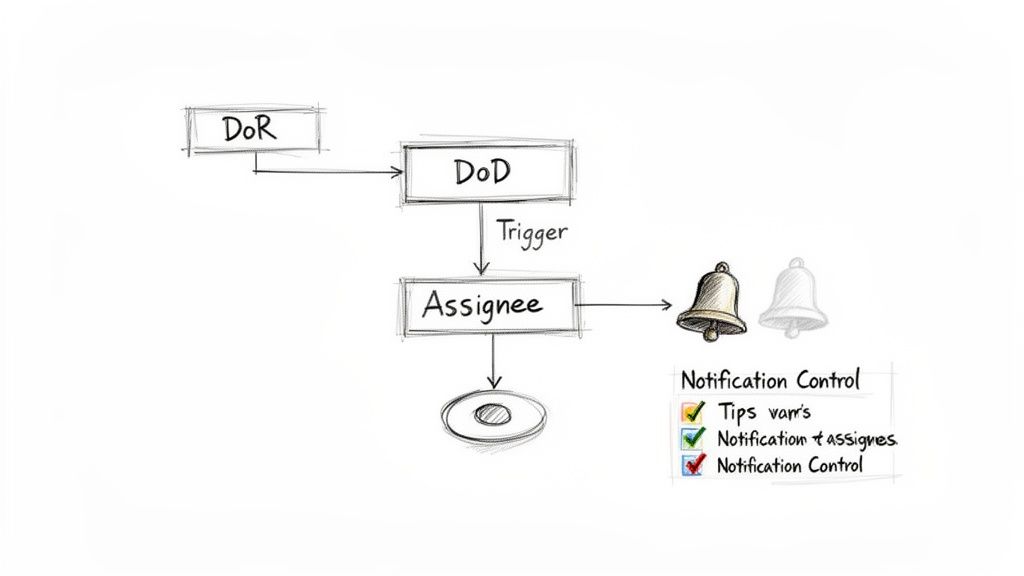
    • Automated Assignee Changes: When the DoD is met, instantly reassign the Jira ticket to the QA lead or the next person in line.
    • Targeted Notifications: Post a message in the #qa-team channel that clearly states the ticket is ready and includes a link to the completed checklist.
    • Contextual Information: Configure the automated message to pull key details from Jira, giving the QA team the context they need without leaving Slack.

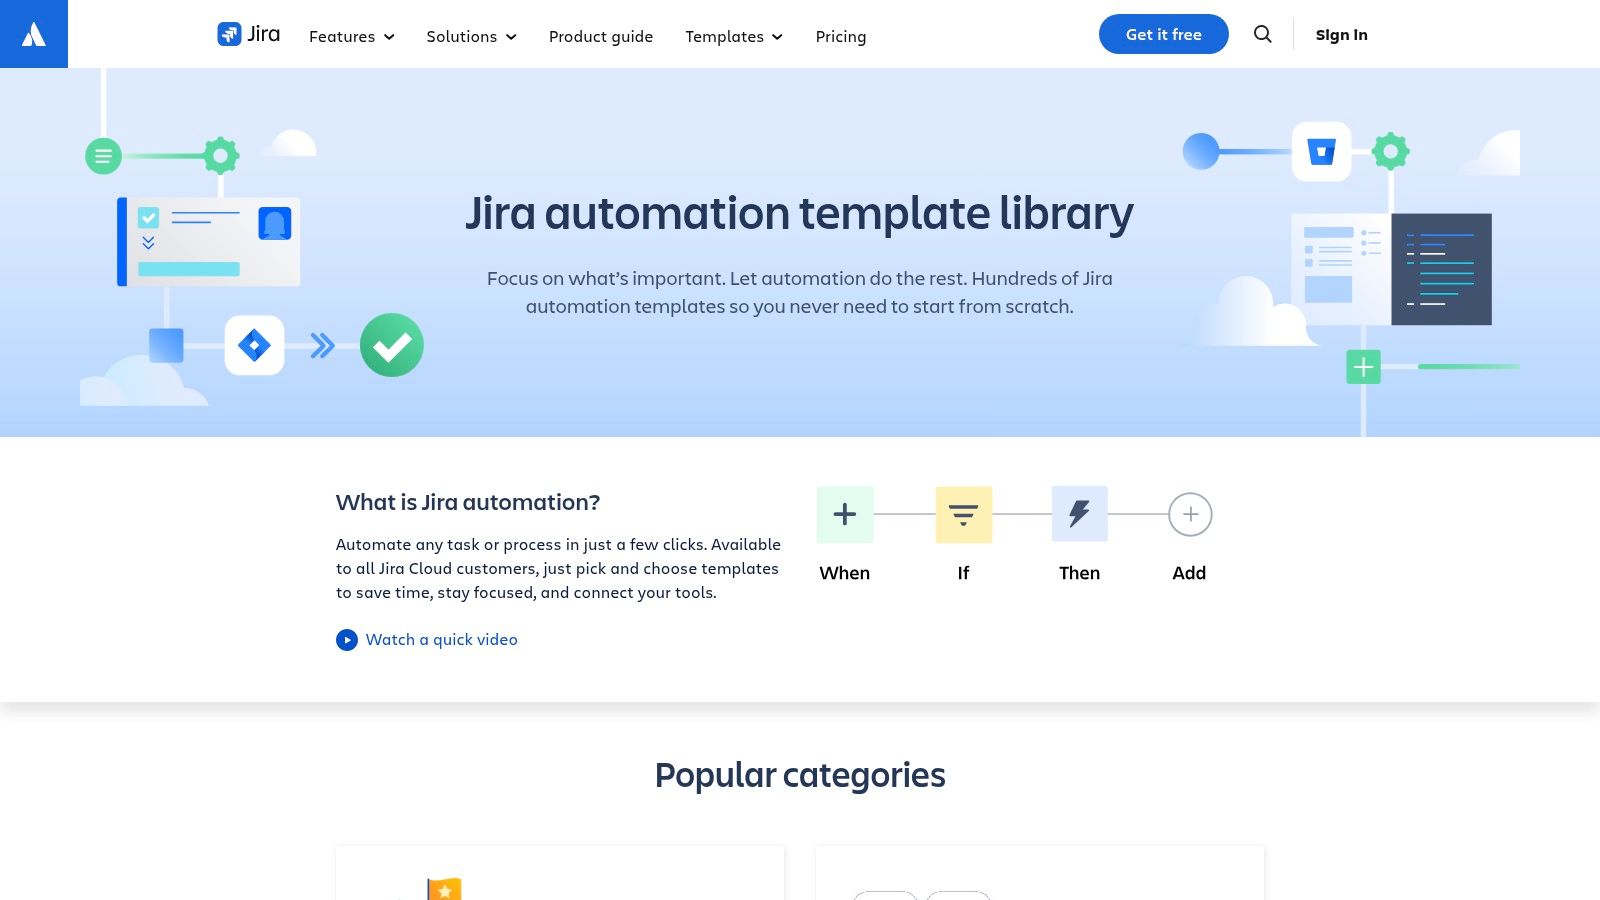
    Building these automated handoffs creates a workflow that flows without friction. To learn more, explore the possibilities of Jira workflow automation.

    Avoid Notification Fatigue

    A common pitfall is creating a system that is too noisy. If every checklist item triggers a channel-wide notification, people will start to ignore them. You must be strategic with your alerts.

    Action Step: Reserve channel-wide notifications for major events—a completed DoD, a deployment going live, or a critical blocker. For individual task assignments or reminders, use direct messages. This keeps your main channels clean and focused on high-signal information that the entire team needs to see.

    Got Questions About Slack Checklists? We've Got Answers.

    When teams start implementing structured processes in Slack, a few key questions always come up. Answering these common challenges is key to choosing an approach that will be adopted successfully.

    Here are the most frequent questions and their solutions.

    Can I Make a Checklist That Repeats Automatically?

    This is the most common requirement. For a weekly deployment or monthly report, you want a checklist to appear on schedule without manual effort.

    You can use Slack's native /remind command to post a list on a schedule, but it's not a true solution. It's just text. You get no templates, no progress tracking, and you have to manually assign tasks each time. It creates more work than it saves.

    Solution: For any recurring process like a monthly release cycle or sprint planning, use a dedicated tool. A third-party checklist app or a deep Jira integration like Nesty is designed for this. You can create a detailed template once and then trigger it automatically on a schedule, ensuring consistency every time.

    How Do I Make Sure People See Their Assigned Tasks?

    "I assigned it, but they never saw it" is a common complaint. When you just edit a Slack message to @mention someone, it's easy for that assignment to get lost in a busy channel.

    A purpose-built checklist tool solves this problem directly.

    Solution: Most third-party apps and advanced integrations like Nesty don't leave this to chance. When a task is assigned, the app automatically sends a direct notification to that specific person. This proactive "tap on the shoulder" ensures they see their new task immediately, which is critical for preventing dropped batons in a fast-paced workflow.

    What’s the Best Way to Keep a Record for Audits?

    Finally, how do you maintain a reliable record for compliance, security reviews, or process improvement?

    Trying to track who checked what and when in a Slack channel is impossible for anything requiring an audit trail, such as release deployments or DoD verification. Messages get lost, and there is no permanent, unchangeable log.

    Solution: The only reliable method is to use an integration that syncs to a system of record like Jira. Tools like Nesty are designed so that every completed checklist item in Slack is logged permanently in the connected Jira issue. This creates a concrete, unchangeable history of who did what and when. It’s the bulletproof audit trail you need for any serious review process.


    Ready to stop chasing down updates and build automated, auditable workflows between Jira and Slack? With Harmonize Pro's Nesty app, you can enforce your Definition of Done, automate handoffs, and create self-managing processes that give you back your time. Learn more and get started with Nesty.

  • 7 Actionable Sample Jira Workflows and Templates to Use in 2026

    7 Actionable Sample Jira Workflows and Templates to Use in 2026

    Jira's default workflows are a solid starting point, but they rarely capture the complex, real-world processes that drive modern software development, QA, and operations. Generic setups lead to bottlenecks, missed handoffs, and a lack of clarity, forcing teams to use manual tracking and out-of-band communication. To unlock genuine productivity, you must adapt Jira to your team's precise needs. This means moving beyond basic "To Do -> In Progress -> Done" models and implementing structured, automated, and battle-tested processes.

    This guide provides a curated collection of actionable sample Jira workflows designed for specific, high-impact use cases. We'll move past theory and dive straight into practical examples, including developer-to-QA handoffs, multi-environment deployment pipelines, release gating with integrated checklists, and customer onboarding funnels. To truly transform your processes, a solid understanding of the core Jira platform is essential, and these examples build upon that foundation.

    Each workflow breakdown includes:

    • A clear use case and the problem it solves.
    • Required statuses, transitions, and screen configurations.
    • Examples of checklist items and quality gates.
    • Actionable ideas for smart triggers and automation rules.
    • Specific tips for implementation, including code snippets and app recommendations.

    Forget sifting through dense documentation. This list is your blueprint for building more efficient, transparent, and powerful Jira workflows. Each entry is a self-contained guide you can adapt and deploy to solve critical process challenges, helping you find the best templates and platforms for your specific needs. You'll find direct links and screenshots to accelerate your implementation.

    1. Harmonize Pro

    Harmonize Pro offers Nesty, a powerful Jira-native application designed to transform static Jira tickets into dynamic, self-managing workflows. It excels by embedding complex, multi-step processes directly within a single Jira issue, eliminating the manual coordination and confusion that plagues cross-functional teams. For organizations needing to build auditable, automated, and enforceable sample Jira workflows, Nesty provides a robust framework.

    The platform’s core strength is automating handoffs and enforcing quality gates. Instead of relying on team members to manually reassign tickets or remember to notify the next person, Nesty’s smart triggers handle it automatically. This ensures that processes like developer-to-QA handoffs or multi-environment deployments are not just mapped out but are actively managed by the system itself, preserving sequence and visibility.

    Harmonize Pro's Nesty app showing nested checklists and automation inside a Jira issue

    Strategic Analysis: Building Intelligent Workflows

    Nesty's standout features—unlimited nested checklists and smart triggers—are the building blocks for creating highly structured and intelligent workflows. This approach allows teams to model reality more accurately than a flat Jira workflow ever could.

    • Unlimited Nested Checklists: Break down large processes (like customer onboarding) into manageable, hierarchical tasks. Each parent task can contain sub-tasks with their own checklists, creating a clear, auditable structure inside one Jira issue.
    • Smart Triggers & Automation: Configure rules that automatically reassign the ticket, notify a Slack channel, or require an artifact (like a test plan PDF) to be attached before a checklist item can be completed. This moves process enforcement from manual policing to system-driven compliance.
    • Enforceable Quality Gates: Use blockers to ensure a ticket cannot progress until specific criteria are met. Build a "Definition of Done" for a development task as a checklist where every item must be completed before the ticket can be automatically handed off to the QA team. This prevents premature transitions and ensures quality at each stage.

    Actionable Takeaways & Practical Applications

    Harmonize Pro's website provides pre-built workflow examples that serve as excellent starting points. You can install Nesty directly from the Atlassian Marketplace and begin modeling your unique processes immediately.

    Workflow Example Key Nesty Features Used Actionable Insight
    Dev → QA Handoff Blockers, Automatic Reassignment, Slack Notifications Build a "Ready for QA" checklist. Use a trigger to auto-reassign the ticket to the QA lead and post a message in the #qa-team Slack channel only after all dev checklist items are complete.
    Multi-Env Deployments Nested Checklists, Artifact Requirements, Role-Based Triggers Create a parent checklist for the release with nested checklists for "Deploy to Staging" and "Deploy to Production." Require a "QA Sign-off" PDF to be attached before the production checklist can be started.
    Customer Onboarding Hierarchical Checklists, Automatic Notifications Model the entire onboarding journey in one ticket. Use smart triggers to notify the customer success manager when the technical setup is complete, ensuring a seamless handoff from the implementation team.

    Strategic Insight: The true power of Nesty is its ability to centralize context. Instead of scattering a process across multiple linked tickets or external documents, the entire history, sequence, and audit trail are contained within a single, self-orchestrating Jira issue.

    While Harmonize Pro provides extensive documentation, plan for an initial setup period to map your processes and configure automation rules. This investment pays off by encoding best practices directly into your Jira instance. The company's blog also offers valuable guidance on implementation; you can learn more about improving Jira workflows on Harmonizepro.com.

    Key Details:

    • Access: Nesty can be installed directly from the Atlassian Marketplace.
    • Pricing: Pricing information is not publicly listed; teams must contact Harmonize Pro for licensing details.
    • Pros: Deep automation, enforces quality gates, centralizes complex processes in one ticket.
    • Cons: Requires a dedicated setup effort, only available for Jira.

    2. Atlassian Marketplace

    Website: https://marketplace.atlassian.com

    The Atlassian Marketplace is the official app store for expanding Jira's capabilities. For teams searching for sample Jira workflows, it's the most direct route to finding, testing, and implementing pre-built processes directly within Jira Cloud. Instead of building from scratch, you can leverage workflows created by trusted vendors.

    The key feature for workflow discovery is the “Import from Marketplace” function within Jira’s workflow editor. This allows you to pull a vendor-provided workflow template directly into your Jira instance, creating a fully functional draft that can be used as-is or customized. This significantly lowers the barrier to entry for complex processes like multi-stage DevOps deployments or intricate QA testing cycles.

    Atlassian Marketplace

    Strategic Breakdown and Actionable Insights

    The Marketplace is a strategic tool for rapid process iteration. Many of the listed workflows are bundled with apps that provide enhanced conditions, validators, and post-functions far beyond Jira's native toolkit. These apps are often where the real power lies, enabling sophisticated automation and validation gates. Beyond the native options, the Atlassian Marketplace offers a wealth of solutions, including some of the best Jira integrations to optimize your web development workflow.

    Actionable Takeaway: Before building a complex workflow, search the Marketplace for apps that solve your core problem (e.g., "release management" or "QA test cycles"). Often, these apps come with a sample workflow that is already optimized for their specific features, saving you dozens of hours in configuration and testing.

    Key Features and Practical Tips

    Feature Description Practical Tip
    Direct Workflow Import Install workflow templates directly from the Marketplace into your Jira Cloud instance. Always install and test a new workflow in a sandbox or development Jira project first. Never import directly into a live production project without thorough vetting.
    App-Bundled Workflows Many apps for automation, checklists, or approvals include their own sample workflows. Look for apps with a "Cloud Fortified" badge. This indicates a higher level of security, reliability, and support vetting from Atlassian.
    Free Trials Nearly all paid apps offer a free trial period (typically 30 days). Use the trial period to fully evaluate not just the app, but also its accompanying workflow. Does it fit your team's process? Can it be easily modified?
    Vendor Documentation Listings include links to vendor documentation, support portals, and version history. Check the "Versions" tab to ensure the app is actively maintained and compatible with your Jira version (Cloud, Data Center, or Server).

    Pros and Cons

    • Pros:
      • The easiest and most integrated way to install and test sample workflows.
      • Centralized location for comparing apps, pricing, and vendor reputation.
      • Security and reliability signals (like partner levels) help in vendor selection.
    • Cons:
      • Workflow quality varies significantly between vendors.
      • Listings can be confusing; you must filter carefully for Jira Cloud compatibility.
      • The best workflows are often tied to paid apps, not available standalone.

    3. Jira Templates Library (Atlassian)

    Website: https://www.atlassian.com/software/jira/templates

    Atlassian’s own Jira Templates Library is the most accessible starting point for finding sample Jira workflows. Integrated directly into the Jira Cloud project creation process, these templates offer turnkey solutions that include pre-configured boards, issue types, and fundamental workflows for various teams. This resource is designed to eliminate initial setup friction, allowing you to launch a structured project in minutes.

    The library's main advantage is its native integration. When you create a new project in Jira, you are prompted to select a template like "Scrum," "Kanban," or "Bug Tracking." Each choice automatically generates a project with an opinionated workflow, providing a ready-made foundation of statuses and transitions that can be immediately used or customized to fit your team's specific needs.

    Jira Templates Library (Atlassian)

    Strategic Breakdown and Actionable Insights

    The Jira Templates Library serves as both an educational tool and a baseline for process standardization. While the workflows are intentionally simple, they are perfect for new teams or for introducing non-technical departments to structured agile processes. Use these templates as a "version 1.0" of your process, then iterate by adding automation rules, custom fields, and more granular transitions as the team matures. Adhering to fundamental principles is key; you can explore some of the Jira workflow best practices to ensure your customizations are effective.

    Actionable Takeaway: When starting a new project, always begin with the closest matching template from the library. Instead of creating a workflow from a blank slate, use the template to handle 80% of the standard setup. Then, focus your administrative efforts on customizing the last 20% to address your team's unique needs, like adding a specific "Peer Review" status or an automated transition for "QA Approved."

    Key Features and Practical Tips

    Feature Description Practical Tip
    Native Project Templates Pre-packaged project configurations with workflows, issue types, and board settings. For a software team, start with the "Scrum" or "Kanban" template and immediately review the workflow diagram. Identify which statuses are unnecessary and which are missing before inviting the full team.
    Team-Specific Blueprints Templates are categorized by team type, such as Software, Business, and Service Management. Don't be limited by the category name. The "Onboarding" template under Business, for example, can be adapted for a technical customer implementation process.
    Integrated Tutorials Many templates come with in-product guidance and links to documentation on best practices. Use the template's default setup for a full sprint. This hands-on experience will reveal its limitations and inform your customization priorities much faster than theory-crafting.
    Simple Workflow Editor The default workflows can be easily edited using Jira's visual workflow editor. Clone the default workflow before making changes. This creates a backup and allows you to switch back to the original if your customizations cause issues.

    Pros and Cons

    • Pros:
      • Completely free and natively integrated into Jira Cloud.
      • Extremely low friction for exploring and deploying baseline workflows.
      • Excellent for aligning non-technical teams on common patterns like Scrum or Kanban.
    • Cons:
      • Workflows are basic and lack the complex validators or conditions of Marketplace apps.
      • Advanced automation and gating require building separate Jira Automation rules.
      • Less suitable for highly regulated or complex, multi-stage processes out of the box.

    4. Jira Automation Template Library (Atlassian)

    Website: https://www.atlassian.com/software/jira/automation-template-library

    While a workflow defines the path an issue can take, automation rules define the actions that happen along that path. The Jira Automation Template Library is Atlassian’s official gallery of pre-built automation rules that enhance your workflows. For teams seeking effective sample Jira workflows, this library is a critical resource for adding the logic, gates, and smarts that make a process work, without needing to write any code.

    These templates offer functional components you can copy directly into your Jira instance. For example, you can find rules to automatically transition an issue when a pull request is merged, assign a sub-task when a parent issue moves to "In Progress," or notify a Slack channel when a high-priority bug is created. This turns a simple workflow into an intelligent, automated system.

    Jira Automation Template Library (Atlassian)

    Strategic Breakdown and Actionable Insights

    The Automation Template Library is the key to moving from a passive workflow (where users manually update everything) to an active one (where the system enforces rules and handles routine tasks). These templates are not just time-savers; they are process-enforcers. They ensure that quality gates are met, handoffs are seamless, and required information is captured at the right stage.

    The real power comes from combining multiple templates. You can use one rule to auto-create QA sub-tasks when a story enters the "Ready for QA" status, another to transition it back to "In Progress" if a QA sub-task is marked as "Failed," and a third to close the parent story when all QA sub-tasks are "Done." This creates a robust, self-managing testing cycle.

    Actionable Takeaway: Browse the library by integration (e.g., "GitHub" or "Slack"). Many of the most powerful workflow automations are triggered by external events. Implementing a rule like "When pull request merged -> Transition to Done" can eliminate one of the most common manual update steps for development teams.

    Key Features and Practical Tips

    Feature Description Practical Tip
    One-Click Rule Import Copy any template from the library directly into your project's automation rules with a single click. Start with simple, high-impact rules like auto-assigning issues or adding comments. This helps your team get comfortable with automation before you implement more complex, transition-based rules.
    Automation Playground A safe, sandboxed environment to test and experiment with automation rules without affecting your live projects. Use the Playground to understand how triggers, conditions, and actions interact. It's perfect for de-risking a complex rule before deploying it to a critical workflow.
    First-Party Integration Patterns Official, battle-tested templates for connecting Jira with tools like Slack, Microsoft Teams, GitHub, and Bitbucket. Prioritize these official integration templates. They are maintained by Atlassian and are less likely to break during platform updates compared to custom-built solutions.
    Category-Based Filtering Templates are organized by function, such as DevOps, ITSM, approvals, and issue management. When designing a new workflow, first sketch the statuses and transitions. Then, use the library's categories to find automation rules that can manage each step of that workflow.

    Pros and Cons

    • Pros:
      • Free to use for all Jira Cloud customers (with plan-based execution limits).
      • Dramatically speeds up the process of adding logic and enforcement to any workflow.
      • No coding required, making it accessible to project managers and team leads.
      • Helps maintain process consistency and reduces manual errors.
    • Cons:
      • Automation execution limits are tied to your Jira pricing plan (e.g., Free, Standard, Premium).
      • Some complex conditional logic or multi-project rules may still require a higher plan or a third-party app.
      • It's a library of rules, not complete workflows, so you still need to design the core workflow structure yourself.

    5. JSU Automation Suite for Jira Workflows (Appfire)

    Website: https://appfire.com/products/jsu

    JSU Automation Suite by Appfire is one of the original and most powerful no-code workflow engines for Jira. While not a direct repository of downloadable workflows, it acts as a critical accelerator, providing the building blocks to transform a basic sample Jira workflow into a powerful, automated, and production-ready process. It bridges the gap between Jira's native capabilities and the complex validation and post-function logic that sophisticated workflows demand.

    The suite operates directly within Jira's workflow editor, adding a vast library of new conditions, validators, and post-functions. This allows you to implement advanced rules without writing code. For example, you can enforce that a "QA Approved" status can only be set if all linked sub-tasks are resolved, or automatically create a follow-up "Documentation" task when an issue moves to "Done".

    JSU Automation Suite for Jira Workflows (Appfire)

    Strategic Breakdown and Actionable Insights

    JSU's strategic value lies in its ability to enforce process integrity and automate manual steps, turning a simple workflow diagram into a self-regulating system. Instead of relying on team members to remember complex procedural rules, you embed those rules directly into the workflow itself. For a deep dive into how such tools transform processes, you can learn more about Jira workflow automation. The app's power is in combining multiple functions to create robust gates and triggers that guide users to follow the correct procedure every time.

    Actionable Takeaway: Identify the biggest bottleneck or point of human error in your current workflow. Search the JSU documentation for a post-function or validator that directly addresses it. For instance, if developers forget to update a field when closing an issue, use JSU's "Update Any Issue Field" post-function on the "Done" transition to automate it.

    Key Features and Practical Tips

    Feature Description Practical Tip
    No-Code Workflow Functions A large library of conditions, validators, and post-functions accessible via a point-and-click interface. Start by enhancing a simple workflow. Add a validator to check if a specific field (like 'Story Points') is filled before an issue can be moved to "In Progress".
    Linked Issue Synchronization Automate actions on linked issues, such as transitioning a parent story when all its sub-tasks are completed. Use this for epic management. Create a post-function to automatically close an epic when its last child story moves to the "Done" status column.
    Advanced Field Control Functions to make fields required, read-only, or hidden based on the issue's status or user's role. During a "Code Review" status, use a JSU function to make the 'Assignee' and 'Story Points' fields read-only to prevent scope creep during the review phase.
    Vendor Documentation & Support Comprehensive documentation with examples for common use cases like approval chains and escalations. Bookmark the JSU "Use Cases" section on the Appfire website. It provides excellent starter patterns and ideas for replicating common business processes.

    Pros and Cons

    • Pros:
      • Empowers non-developers to build highly sophisticated and automated workflows.
      • Vastly extends Jira's native workflow capabilities with minimal effort.
      • Excellent documentation and vendor support from a trusted "Cloud Fortified" partner.
    • Cons:
      • It is a paid app, adding a recurring license cost to your Jira instance.
      • Requires careful planning to avoid creating overly complex or conflicting workflow rules.
      • Long-term use requires budgeting and dependency on the app's license.

    6. Jira Workflow Toolbox (Decadis)

    Website: https://marketplace.atlassian.com/apps/29496/jira-workflow-toolbox

    Jira Workflow Toolbox is not a repository of full workflows but a powerful Jira app that supercharges the workflow editor. It provides a suite of advanced post-functions, conditions, and validators that enable highly sophisticated, rule-based automations. For teams needing sample jira workflows that go beyond simple status changes, the app's documentation provides practical "workflow helpers" and configuration examples that act as mini-templates for complex logic.

    The app stands out by allowing administrators to build dynamic and compliant workflows that would otherwise require custom scripts. For example, you can implement transitions that are only available if a sub-task is in a specific state, or post-functions that calculate and set field values based on complex Jira Expressions. This makes it an essential tool for regulated industries or teams requiring strict process enforcement.

    Jira Workflow Toolbox (Decadis)

    Strategic Breakdown and Actionable Insights

    Jira Workflow Toolbox transforms the workflow editor from a state-management tool into a business process engine. Its value lies in creating workflows that self-enforce rules, reducing manual oversight and human error. Instead of just tracking work, the workflow actively manages it by controlling field values, enforcing parent-child relationships, and orchestrating transitions based on precise conditions.

    The app's support for Jira Expressions is a game-changer for customization. It allows for dynamic logic based on almost any data point within an issue, from user properties to linked issue statuses. This enables the creation of highly tailored sample jira workflows for use cases like GxP compliance, where every step must be validated, or for complex release gating where multiple criteria must be met before an issue can proceed.

    Actionable Takeaway: Use the "Parse fields from text" post-function to automate data entry. For example, configure a workflow transition to scan the description or comments for a specific pattern (like "Version: 2.1.3") and automatically populate the "Fix Version/s" field. This saves time and ensures data consistency.

    Key Features and Practical Tips

    Feature Description Practical Tip
    Advanced Post-Functions A vast library of functions to manipulate fields, link issues, and trigger actions after a transition. Combine the "Copy a parsed text to a field" and "Create/clone issue(s)" post-functions to automatically generate sub-tasks with pre-filled details extracted from the parent issue description.
    Jira Expression Support Use Jira Expressions in conditions and validators to create highly dynamic and specific rules. Use a Jira Expression validator to prevent an issue from transitioning if its linked pull request on Bitbucket has not yet been merged. This creates a hard gate for QA readiness.
    Workflow Helpers The app's documentation includes detailed examples for common but complex workflow scenarios. Before building from scratch, review the official documentation for a helper that matches your goal. The examples provide the exact configuration needed for scenarios like "User is a member of a group."
    Admin Utilities Tools to speed up workflow administration, like copying and pasting post-functions between transitions. When building a complex workflow with repeated logic (e.g., checks on every transition), configure the post-functions once, then use the copy utility to apply them to all relevant transitions quickly.

    Pros and Cons

    • Pros:
      • Enables extremely powerful and granular control over workflow logic.
      • Excellent for building audit-friendly and compliant processes.
      • Strong documentation with practical, copy-paste examples for complex scenarios.
    • Cons:
      • Has a notable learning curve, especially for mastering Jira Expressions.
      • The power and flexibility can be overwhelming for simple use cases.
      • This is a paid app, requiring a subscription through the Atlassian Marketplace.

    7. ScriptRunner Example Scripts (Adaptavist / ScriptRunner)

    Website: https://www.scriptrunnerhq.com/latest/product-updates/sr-for-jira-and-confluence-cloud-example-scripts

    ScriptRunner by Adaptavist is the gold standard for extending Jira’s automation beyond its native limits, and its library of example scripts is an invaluable resource. For teams needing highly customized sample Jira workflows, this platform offers the building blocks to solve complex problems that no-code automation tools cannot handle. It provides hundreds of vetted Groovy scripts for workflow validators, conditions, and post-functions.

    The platform's strength is bridging the gap between simple automation and custom development. Instead of searching forums for code snippets, you can access a curated, searchable library of examples directly on the ScriptRunner website or within Jira itself via the app's "Example Scripts" modal. This allows you to find, copy, and adapt working code for your specific use case, dramatically accelerating the development of sophisticated workflow logic.

    ScriptRunner Example Scripts (Adaptavist / ScriptRunner)

    Strategic Breakdown and Actionable Insights

    ScriptRunner's examples are templates for strategic process enforcement. These scripts enable you to build workflows with validation gates that are impossible with native Jira, such as checking fields in linked issues or ensuring a sub-task meets specific criteria before a parent issue can be transitioned. This unlocks a level of process control essential for regulated industries or teams with strict compliance requirements.

    Actionable Takeaway: Identify the biggest manual bottleneck in your current workflow. Search the ScriptRunner examples library for keywords related to that problem (e.g., "linked issues," "sub-task," "attachment required"). You will likely find a pre-built script that solves 80% of your problem, requiring only minor tweaks to fit your exact field names and project keys.

    Key Features and Practical Tips

    Feature Description Practical Tip
    Example Scripts Library Hundreds of searchable, ready-to-use Groovy scripts for validators, post-functions, and listeners. Use the website's search and filter functions to narrow down by Jira platform (Cloud/Data Center) and script type. The comments within the scripts are excellent learning tools.
    In-App Script Modal Browse, filter, and copy example scripts directly within the ScriptRunner interface inside Jira. When using the in-app modal, pay close attention to the context. The modal often filters examples relevant to the specific workflow function you are editing, saving you time.
    Detailed Documentation Each example is accompanied by explanations and links to relevant product documentation. Before adapting a script, read the associated documentation to understand the APIs it uses. This will help you modify it correctly and avoid common errors.
    Low-Code Approach Scripts provide a robust starting point that often requires only minor modifications. Start by copying a script and using it in a test project's workflow. Change only one thing at a time (like a custom field ID or project key) to ensure you understand its impact.

    Pros and Cons

    • Pros:
      • Provides vetted, working code that accelerates custom workflow development.
      • Enables extremely powerful and flexible automation for edge cases.
      • Speeds up the learning curve for using ScriptRunner and Groovy.
    • Cons:
      • Requires a paid ScriptRunner for Jira license to implement the scripts.
      • A basic understanding of Groovy or scripting logic is necessary for customization.
      • Poorly adapted scripts can impact Jira performance if not tested properly.

    Top 7 Sample Jira Workflow Tools Comparison

    Solution / Item Implementation Complexity 🔄 Resource Requirements ⚡ Expected Outcomes 📊 Ideal Use Cases 💡 Key Advantages ⭐
    Harmonize Pro (Nesty) Moderate–High; requires rule design and change management 🔄 Jira-only; vendor docs/support; admin time; pricing via contact ⚡ Centralized, auditable self‑managing workflows; fewer missed handoffs 📊 ⭐⭐⭐ Cross‑functional handoffs, multi‑env deployments, structured onboarding 💡 Unlimited nested checklists, smart triggers, Slack/Teams integration, audit trails ⭐
    Atlassian Marketplace Low; install/import per app, quality varies 🔄 Jira Cloud account; evaluate vendors; sandbox testing recommended ⚡ Fast access to many workflow apps/templates; variable reliability 📊 ⭐⭐ Finding and testing third‑party workflow tools and importable packs 💡 Centralized catalog, trials, security/vetting signals (Cloud Fortified) ⭐
    Jira Templates Library (Atlassian) Very low; turnkey templates and boards 🔄 Native to Jira Cloud; minimal admin effort ⚡ Ready starter projects and standard workflows; quick alignment 📊 ⭐ Small or non‑technical teams, quick project bootstraps 💡 Free, native templates with integrated tutorials ⭐
    Jira Automation Template Library (Atlassian) Low–Moderate; copy and tweak automation rules 🔄 Jira Cloud; automation execution quotas depend on plan ⚡ Enforces gates/notifications without code; faster logic adoption 📊 ⭐⭐ Adding workflow logic, auto‑transitions, notifications, simple gates 💡 Hundreds of templates, sandbox playground, first‑party integration patterns ⭐
    JSU Automation Suite (Appfire) Moderate; no‑code flows but requires admin setup 🔄 Paid add‑on license; admin configuration time ⚡ Production‑ready post‑functions and validators without coding 📊 ⭐⭐ Admins building approvals, escalations, linked transitions 💡 Drag‑and‑drop no‑code setup, rich post‑functions, vendor support ⭐
    Jira Workflow Toolbox (Decadis) Moderate–High; expression logic has learning curve 🔄 Paid app; admin familiarity with expressions recommended ⚡ Sophisticated branching and compliance checks; audit‑friendly flows 📊 ⭐⭐ Regulated environments, complex field logic and orchestration 💡 Extensive post‑functions, validators, Jira Expressions support ⭐
    ScriptRunner Example Scripts (Adaptavist) High if customizing; examples reduce development time 🔄 ScriptRunner license required; Groovy/low‑code skills helpful ⚡ Maximum flexibility for edge cases and complex automations 📊 ⭐⭐⭐ Advanced custom logic, integrations, bespoke workflow behaviors 💡 Large searchable library of vetted scripts, in‑app examples, deep customization ⭐

    From Sample to System: Making These Workflows Your Own

    We've explored a powerful collection of resources for finding, adapting, and enhancing your Jira processes. From the ready-made templates in the Atlassian Marketplace and Jira's native libraries to the sophisticated customization offered by tools like JSU, Jira Workflow Toolbox, and ScriptRunner, the path to a high-performing workflow is clear. The goal isn't just to copy these examples; it's to use them as blueprints to build a system that perfectly mirrors your team's operational reality.

    Each sample workflow, whether for a complex multi-environment deployment or a streamlined customer onboarding process, shows how to bake in quality gates, automate handoffs, and provide stakeholders with the visibility they need. Your objective is to deconstruct these blueprints and apply the underlying principles to your own process challenges.

    Key Takeaways: Your Workflow Implementation Checklist

    As you move from inspiration to implementation, remember that the most effective sample jira workflows are not rigid prescriptions but flexible frameworks designed for evolution.

    • Start with the "Why": Before adding a single status, clearly define the problem you're solving. Are you reducing QA bottlenecks? Improving deployment safety? Your objective will guide every decision.
    • Simplicity is a Feature: It's tempting to build a workflow that accounts for every edge case. Resist this. A simpler workflow is easier to understand, adopt, and maintain. Start with the minimum viable process and iterate.
    • Automate the Toil: Identify every repetitive, manual task in your process. These are your prime candidates for automation. Use Jira's native automation or advanced tools to handle status updates, notifications, and sub-task creation so your team can focus on high-value work.
    • Clarity Over Complexity: Ensure that statuses are unambiguous and transitions are intuitive. A team member should be able to look at an issue and immediately understand its current state and what needs to happen next.

    Actionable Next Steps: Putting Theory into Practice

    Reading about sample jira workflows is the first step. Now, it's time to build. Here’s how to get started today.

    1. Conduct a Workflow Audit: Choose one of your existing, high-friction workflows. Map it out on a whiteboard and have the team identify its pain points. Where do tickets get stuck? Where are the communication breakdowns?
    2. Select a Relevant Template: Based on your audit, browse the resources we’ve discussed. Find a sample workflow that addresses a similar problem. Don't look for a perfect match; look for a solid foundation to build upon.
    3. Customize and Test in a Sandbox: Never roll out a new workflow directly into production. Use a Jira sandbox or a staging project to build and test your new process. Have team members run test issues through the entire workflow to catch any confusing steps or broken logic.
    4. Document and Train: Once you're confident in the new workflow, create simple, clear documentation. A one-page visual guide is often more effective than a lengthy document. Hold a brief training session to walk the team through the changes and explain the "why" behind them.

    Ultimately, your Jira instance should be a strategic asset, not just a task tracker. By thoughtfully selecting, adapting, and implementing the right workflow, you transform your processes from a series of disjointed tasks into a streamlined system that accelerates delivery, enhances quality, and empowers your team to do their best work.


    Ready to elevate your workflow with powerful, built-in checklists and gating? Harmonize Pro integrates directly into your Jira issues, allowing you to build the sophisticated quality gates and standardized processes we've discussed without complex configuration. See how you can enforce critical steps and streamline your Jira workflows by visiting Harmonize Pro.

  • Jira and Power BI A Guide to Actionable Dashboards

    Jira and Power BI A Guide to Actionable Dashboards

    Connecting Jira to Power BI is more than just ditching manual CSV exports. It's about turning your raw project data into a powerhouse for strategic decision-making. You're moving from simple, static charts to real-time, interactive business intelligence. The goal is to build dashboards that let you visualize everything from sprint health and cycle times to bug resolution rates, all in one place.

    Why Jira and Power BI Is A Powerful Combination

    Linking these two platforms creates a single source of truth that changes how your organization uses project data. Engineering leads, QA managers, and product owners can finally have data-driven conversations with stakeholders who don't spend their days inside Jira. The immediate, actionable goal is to spot project risks long before they spiral into major problems.

    This pairing helps you get ahead of the curve, shifting from reactive fire-fighting to proactive strategy. Instead of digging through a dozen tickets to explain a missed deadline, you can pull up a dashboard that clearly shows a bottleneck in the QA handoff process.

    Unlock Strategic Business Insights

    The magic happens when you stop exporting spreadsheets and start building dynamic reports. This move allows for much deeper analysis and helps everyone make smarter decisions, faster. To get a feel for what’s possible, it helps to know how Power BI fits into the larger Microsoft Power Platform.

    For large organizations trying to scale their project analytics, this integration is a game-changer. Teams that use a dedicated Jira-to-Power BI connector can build unlimited custom datasets using JQL, allowing for truly tailored dashboards for sprint metrics and bug trends. You can check out some of these Jira and Power BI connector capabilities to see what's possible.

    The bottom line is this: you’re transforming Jira from a simple task tracker into a robust business intelligence engine. It gives you the visibility needed to fine-tune workflows, boost team performance, and deliver projects with far more predictability.

    From Manual Reporting to Automated Dashboards

    Think about what you could do with the hours you'd save by not having to manually compile data every week. That's what this automation does—it handles the grunt work, freeing you up for more important strategic thinking.

    • Visualize Sprint Health: Get an immediate answer to "Are we on track?" by monitoring burndown charts, scope creep, and story point completion in real-time.
    • Analyze Cycle and Lead Times: Pinpoint exactly where work gets bogged down in your development process, from the moment a task is started to when it's finally marked "Done."
    • Monitor Bug Resolution Rates: Get a clear picture of how quickly your team crushes critical bugs and measure the overall quality of your releases.

    Automating these reports means everyone is always looking at the freshest data. Of course, the quality of your reports depends on the quality of your data. Following the best practices in Jira from the very beginning ensures your Power BI dashboards are both accurate and reliable.

    Choosing Your Jira to Power BI Connection Method

    So, you want to get your Jira data into Power BI. Good call. But how you build that bridge is the first big decision you'll make, and it's a trade-off between control, convenience, and how much you want to tinker under the hood. The right path really depends on your team’s technical chops, what you need to report on, and frankly, how much time you have to spare.

    Let's start with the most hands-on approach: using Jira’s native REST API with Power BI's Web connector. This route gives you ultimate control. If you love writing very specific JQL queries to pull exactly the data you need and nothing more, this is for you. But with great power comes great responsibility. You're on the hook for managing API token authentication and—this is a big one—staying within Jira's rate limits to avoid getting throttled. The Atlassian community forum has some great discussions if you decide to go down this rabbit hole.

    At the complete opposite end of the spectrum is the humble CSV export. Need a quick data snapshot for a single presentation tomorrow? This is your answer. It's fast, simple, and gets the job done for one-off tasks. But let's be clear: it's a manual process, it doesn't scale, and it’s completely impractical for any kind of ongoing, automated reporting.

    Finding the Right Balance for Your Team

    For most engineering and QA teams I've worked with, the sweet spot is a third-party marketplace connector. These tools are purpose-built to do one thing well: connect Jira to Power BI. They handle all the messy stuff—authentication, API pagination, rate limiting—so you don't have to. You get to skip the infrastructure headaches and jump straight into building reports.

    This approach is a lifesaver, especially if you don't have a data engineer on standby. It just works, ensuring your data refreshes are consistent and reliable.

    To help you figure out where you land, this decision guide lays out the options based on your end goal.

    Flowchart for Jira and Power BI: a decision guide for data-driven insights based on reporting needs.

    As you can see, if you're aiming for strategic, ongoing business intelligence, you'll want a dedicated connection. For those quick-and-dirty analyses, a manual export might be all you need.

    Jira to Power BI Connection Method Comparison

    To make the choice even clearer, let's put these methods side-by-side. Seeing the pros and cons laid out can quickly highlight the best fit for your situation.

    Method Technical Effort Best For Key Limitation
    Marketplace Connector Low Automated, scalable, and reliable dashboards with minimal setup. Requires a subscription for a third-party application.
    REST API + Web Connector High Full control over data queries and complex, custom integrations. Requires ongoing management of API tokens and rate limits.
    CSV Export Very Low Quick, one-time data analysis for presentations or simple charts. Completely manual, not scalable, and prone to human error.

    Ultimately, picking the right connection method is about setting a solid foundation. Once you have a reliable data pipeline in place, you’re ready for the fun part. The next step is to learn how to create a report in Jira that actually tells a story with your metrics.

    Crafting Your Dataset with JQL and Custom Fields

    The quality of your Power BI dashboards lives and dies by the data you pull from Jira. It's a classic case of "garbage in, garbage out." This is where getting good with Jira Query Language (JQL) becomes your most valuable skill, letting you move past generic data dumps and start building clean, focused datasets.

    Think of JQL as a precision filter. Instead of trying to import every single issue from your entire Jira instance—which is a recipe for slow reports and headaches—you can write queries that pull only the data you actually need. This not only makes your reports faster but also keeps your data model much simpler to manage down the line.

    Diagram illustrating a filtered dataset funnel processing JQL queries for custom fields and story points.

    Building Smart JQL Queries

    A sharp, well-written JQL query is the bedrock of any useful dashboard. It's your first line of defense, making sure only relevant information ever makes it into your analysis.

    For instance, a QA manager probably doesn't need to see every story and task. They might only care about bugs from a specific project that were wrapped up in the last sprint. A good JQL query makes that possible.

    Here are a few practical examples you can adapt right now:

    • Bugs Resolved Last Sprint: project = "Phoenix" AND issuetype = "Bug" AND status = "Done" AND resolutiondate >= startOfWeek(-1) AND resolutiondate <= endOfWeek()
    • Stories for an Upcoming Release: project = "MobileApp" AND issuetype = "Story" AND fixVersion = "Q3 Release"
    • High-Priority Tech Debt: project = "BackendServices" AND labels = "tech-debt" AND priority = "High"

    Queries like these give you a targeted, manageable dataset that’s so much easier to work with in Power BI. For a deeper look at the logic, the same principles for building filters apply, and this guide on how to create a filter in Jira is a great resource.

    Taming Jira Custom Fields

    Let's be honest, the real insights are often buried in your custom fields. I’m talking about things like Story Points, Epic Link, or maybe team-specific statuses you’ve configured. Unfortunately, these fields are notorious for causing trouble when you pull them into Power BI. They often show up as nested records or lists, not the clean, simple columns you want.

    The secret is to go in expecting this. When you connect to Jira, you should know that you will almost certainly need to spend time in Power Query to "un-nest" or expand those custom field columns to get to the good stuff.

    A perfect example is the "Story Points" field. It might import as a record that you have to click into. You’ll need to use Power Query's "Expand Column" feature to pull out the actual number. Another common one is a "Components" field, which might be a list. To analyze work by component, you'll have to expand that list into new rows.

    Dealing with these fields isn’t something you do at the end; it’s a core part of building a solid data model from the start. By planning ahead to extract data from these critical fields, you’re ensuring your reports can answer the questions that really matter, like measuring team velocity or tracking progress against epics. This prep work is what turns a messy data dump into a powerful asset.

    Shaping Your Data for Performance and Insight

    Pulling your Jira data into Power BI is a solid first step, but let's be honest—the raw data is a mess. It's not even close to being report-ready. Think of it as a pile of groceries on your kitchen counter; you can't just serve it up. You have to prep, chop, and combine everything to make something useful. This is exactly where Power Query, Power BI’s data transformation engine, becomes your best friend.

    Your first job is to take all that messy, nested data from Jira and flatten it into clean, usable columns. This initial shaping phase is absolutely non-negotiable if you want a data model that performs well and actually makes sense. It’s the foundation for everything else you'll build.

    Essential Data Shaping in Power Query

    When you first load Jira data, especially from a REST API or a connector, you'll see a lot of columns that just say [Record] or [List]. This is a classic sign of nested data, and it's especially common with custom fields, assignees, components, and other complex fields. The goal here is to expand those records and lists into valuable information.

    Start by zeroing in on the most critical columns containing this nested data. The fields column is almost always the main culprit, often hiding dozens of other fields inside of it.

    • Expand Nested Records: Find the column header with the double-arrow icon, right-click it, and choose "Expand." Be selective here. Only pick the fields you actually need for your reports, like summary, issuetype, status, and created. Deselecting everything else is one of the most effective performance optimizations you can make.
    • Split Columns: Sometimes data gets jammed together, like a user's name and their ID. The "Split Column" feature is perfect for breaking these into separate, more useful columns.
    • Change Data Types: Power BI does its best to guess data types, but you have to double-check its work. Make sure dates are set to Date/Time, story points are Whole Number, and any time-tracking fields are Decimal Number. Getting these wrong is a surefire way to run into frustrating DAX errors down the road.

    Here's a piece of hard-won advice: remove any columns you don't need for your final report as early as possible in your Power Query steps. Every single extra column bloats your data model, which can kill your refresh times and make your report feel sluggish.

    Modeling for Key Jira Metrics

    Once your data is clean and tidy, it's time to build the data model. This is where you create relationships between your different queries and start writing DAX (Data Analysis Expressions) measures to calculate the metrics that truly matter to your team.

    For instance, you'll likely have one query for your Jira issues and another for your sprint details. By creating a relationship between them (probably on a sprint.id field), you can analyze issue data within the context of specific sprints.

    The data model is where you embed your core business logic. Instead of doing one-off calculations inside individual charts, you create centralized DAX measures. This keeps everything consistent and reliable across your entire report.

    Here are a few essential DAX formulas to get you started:

    • Cycle Time: Cycle Time = DATEDIFF(Issues[InProgressDate], Issues[DoneDate], DAY)
    • Lead Time: Lead Time = DATEDIFF(Issues[CreatedDate], Issues[DoneDate], DAY)
    • Total Story Points: Total Story Points = SUM(Issues[StoryPoints])

    Creating these as measures, rather than calculated columns, is almost always better for performance. They get calculated on the fly when someone interacts with a visual, keeping the report feeling fast and responsive.

    The Impact of Structured Jira Workflows

    The cleaner your Jira process is, the easier your Power BI reporting will be. Inconsistent workflows where teams use different statuses or skip critical steps just create a data nightmare. You end up having to build complex, fragile workarounds in Power Query to clean it all up.

    This is where tools like Nesty for Jira can be a game-changer. By enforcing structured workflows with features like nested checklists and automated transitions, you guarantee every issue follows a predictable path. You can, for example, build a workflow that automatically captures the precise timestamp when a ticket moves from "In Progress" to "In Review."

    That kind of process discipline means the data flowing into Power BI is already clean, consistent, and trustworthy. You'll spend far less time wrestling with data transformations and way more time uncovering actual insights.

    Building Dashboards Your Team Will Actually Use

    Alright, you've connected Jira, pulled in your data, and shaped it into something useful. Now comes the fun part: building dashboards that your engineering and QA teams will actually want to use. The goal here isn't just to make pretty charts; it's to answer real-world questions and drive meaningful improvements.

    A great dashboard tells a story at a glance. A team lead should be able to look at it and immediately spot a bottleneck, understand how a sprint is tracking, or get a handle on quality, all without having to manually sift through Jira tickets. This is where the magic of combining deep Jira data with Power BI's visualization capabilities really happens.

    A digital dashboard displays three charts: Sprint Health, Cycle Time, and QA Handoff, showing project metrics.

    Look at the dashboard above. It's a perfect example of how combining metrics like burndown, cycle time, and handoffs gives a complete picture of project health. It's all about picking the right visuals to tell the right story for the people who need to hear it.

    The Sprint Health Dashboard

    Every engineering manager lives and breathes by one question: "Is this sprint on track?" A Sprint Health dashboard gives them that answer instantly.

    Don't just stop at a basic burndown chart, though. Make it interactive. Overlay a line chart showing the ideal burndown against the actual remaining work. Right next to it, add a stacked bar chart that shows completed story points versus scope creep—any story points that were added after the sprint started. This immediately tells you, "Are we behind schedule because we're slow, or because we keep adding more work?"

    • Actionable Question: "Are we going to hit our sprint goal, and what's standing in our way?"
    • Key Visuals: A line chart for the burndown, a stacked bar for scope changes, and a few KPI cards for the completion percentage.
    • Metrics to Display: Remaining Work (in Story Points or Hours), Completed Work, Added Work (Scope Creep), and Team Velocity.

    Cycle Time Analysis for Bottleneck Detection

    Cycle time is, without a doubt, one of the most insightful metrics you can track. It measures the total time from when work starts ("In Progress") to when it’s truly finished ("Done"). A solid Cycle Time dashboard is your best tool for finding out exactly where work is getting stuck.

    My favorite visual for this is a scatter plot. I plot each completed ticket with its creation date on the X-axis and its cycle time in days on the Y-axis. You can instantly spot the outliers—those tickets that took forever—and see if your cycle time is trending up or down.

    Another great option is a simple bar chart showing the average cycle time broken down by issue type or even by assignee. You might discover that bugs take way longer to fix than stories, or that one particular developer is consistently getting overloaded. As you get your hands dirty building these, this practical guide on how to create a Power BI dashboard is a fantastic resource, walking you through everything from connecting data to creating compelling visuals.

    QA Handoff and Quality Metrics

    The handoff between developers and the QA team is a classic source of friction. A QA Handoff report shines a light on this critical step, measuring how long tickets languish in a "Ready for QA" status before someone actually starts testing them.

    For this, I often use a straightforward table or matrix visual. List all the tickets currently waiting for QA and sort them by the longest wait time. You could even add a gauge visual to track the average handoff time against a target, like a 48-hour service-level agreement (SLA). It’s a simple but effective way to encourage everyone to keep work flowing smoothly through the system.

    Common Questions About Jira and Power BI

    Even with a solid plan, connecting Jira and Power BI can throw some curveballs. Let's walk through a few of the most common snags I've seen teams run into and how to get past them.

    These issues pop up all the time, but the fixes are usually pretty straightforward once you know where to look. Nailing these details is the key to building a reporting setup you can actually rely on.

    How Do I Handle Jira API Rate Limits in Power BI?

    Ah, the dreaded Jira API rate limit. It's there to protect Atlassian's servers, but it can easily torpedo your scheduled data refreshes, especially with large datasets. The classic sign? A timeout error right in the middle of a refresh.

    The easiest first step is to schedule your Power BI refreshes during off-peak hours, like overnight. But if you're pulling a lot of data directly from the API, your best bet is to set up incremental refresh in Power BI. This is a game-changer. It tells Power BI to only grab issues that have been created or updated since the last run, slashing the number of API calls you make.

    For companies with huge or super-active Jira instances, a dedicated third-party connector is often the sanest path forward. These tools are built from the ground up to manage API calls efficiently, automatically handle rate limits, and use smart backoff logic. It takes all the guesswork out of keeping your data pipeline stable.

    Why Are My Custom Fields Not Showing Up Correctly?

    I get this question more than any other. You've got critical data in a custom field, but when you pull it into Power BI, all you see is [Record] or [List]. Don't panic—this is completely normal.

    Your data isn't gone; it's just nested inside that column. You just need to unpack it in the Power Query Editor.

    • If you see [Record]: Click the expand icon (it looks like two arrows pointing away from each other) in the column header. This will reveal the underlying properties, letting you pick the specific values you need, like .name or .value.
    • If you see [List]: This usually means you're dealing with a multi-select field. The "Expand to New Rows" option is your friend here. It will create a separate row for each selected value, which makes it possible to properly filter and analyze them.

    What Is the Best Way to Calculate Cycle Time in Power BI?

    Calculating accurate cycle and lead times is all about having access to the issue history. You absolutely need the timestamps for when an issue moved into and out of each status in your workflow.

    The most reliable way to get this is by using a connector that's specifically designed to pull Jira's full issue history. This gives you a clean, pre-packaged table of all status transitions, ready to go. If you're hitting the API directly, you'll have to add changelog to the expand parameter in your query to get this data.

    Once you have the history, you can build your calculations in Power BI using DAX. The DATEDIFF() function is your workhorse here. You’d create a measure that finds the timestamp for an issue entering "In Progress" and another for it entering "Done," then calculate the difference in days.


    For teams that want to guarantee this data is clean from the very beginning, a tool like Harmonize Pro can be a huge help. Their app, Nesty for Jira, helps enforce structured workflows right inside Jira, making sure every status change is captured consistently. When your source data is that clean and reliable, building powerful Power BI dashboards for metrics like cycle time becomes much, much easier.

  • Zephyr for Jira: A Practical Guide to QA Orchestration

    Zephyr for Jira: A Practical Guide to QA Orchestration

    If you've worked in software development, you've seen the gap. Developers manage tasks in Jira, while the QA team tracks tests in spreadsheets or an external tool. This split creates a communication black hole where context is lost and bugs slip through.

    Zephyr for Jira is a native Jira app designed to close that gap. It embeds a complete test management system directly into your projects, eliminating the need for context switching and disconnected tools. It turns Jira into a single source of truth for both development and quality assurance.

    How Zephyr Bridges the Dev-to-QA Gap

    When a developer finishes a feature, how does QA know which tests to run? When a bug is found, how can you trace it back to the specific requirement and test case that failed? Zephyr provides direct answers to these questions by integrating testing into your development workflow.

    It introduces new Jira issue types—Test, Test Plan, and Test Execution—that live alongside your stories and tasks. This native integration is the key to its effectiveness.

    Why Native Integration is a Game-Changer

    Because Zephyr lives inside Jira, your test cases are actual Jira issues. This allows you to link them directly to user stories and defects, creating a transparent, interconnected system with immediate benefits.

    • Actionable Traceability: See exactly which tests cover a feature, review pass/fail history, and trace every bug back to its source test case. This is crucial for impact analysis and regression planning.
    • Unified Workflow: Developers and QA engineers work from the same boards and use the same language. This reduces friction and makes collaboration seamless. To start, get both teams to agree on a single workflow for stories that includes a "Ready for QA" status.
    • Live Reporting: All your testing metrics are available in Jira dashboards. Set up a simple dashboard with gadgets for "Test Execution Progress" and "Top Defects Found" to give everyone immediate visibility into project health.

    Actionable Tip: By embedding test management within Jira, you can make quality a shared responsibility. Create a workflow where developers are required to link their user stories to existing test cases before handing them off to QA.

    Which Zephyr is Right for You?

    Zephyr comes in two primary versions, each tailored to different team sizes and needs. Zephyr Squad is designed for agile teams needing a quick, simple solution within a single project. Zephyr Scale is for larger organizations requiring advanced features like reusable test libraries across multiple projects and detailed versioning.

    As part of the SmartBear portfolio, Zephyr is widely used in large enterprises. Market data reveals that 42% of its customers have over 1,000 employees, and 39% report revenues exceeding $1 billion. You can explore the data on Zephyr's enterprise adoption on Enlyft.com.

    Mastering Core Zephyr Workflows and Features

    To use Zephyr for Jira effectively, you need to understand its core building blocks: Test Cases, Test Cycles, and Test Executions. Mastering this structure is the first step toward building an organized and repeatable QA process.

    A Test Case is a reusable Jira issue containing the steps to validate a specific piece of functionality, like "Verify user can log in with a valid password." Your goal is to build a comprehensive library of these test cases. For practical advice on organizing them, read our guide on managing test cases in Jira.

    The Testing Lifecycle in Action

    When it's time to test a new feature or release, you group relevant test cases into a Test Cycle. Think of this as a testing assignment. For example, create a "Sprint 3.2 Regression" cycle and add all tests related to features modified in that sprint.

    Once the cycle is ready, a QA engineer begins the Test Execution. This is the practical step of running each test and marking its status: Pass, Fail, Blocked, or Work in Progress. This action provides immediate, real-time feedback on testing progress directly within your Jira project.

    This diagram illustrates how Zephyr integrates these components into your development workflow.

    Diagram illustrating Zephyr's role in Jira, managing requirements, creating test cases, and handling defects.

    As you can see, Jira acts as the central hub, linking requirements to the tests that validate them and the defects discovered during the process.

    To get started quickly, familiarize yourself with these essential terms.

    Zephyr for Jira Key Terminology Explained

    Term Description Actionable Use Case
    Test Case A Jira issue with steps to validate a requirement. Create a script to test one function, e.g., "Verify password reset email is sent."
    Test Cycle A container grouping test cases for a specific effort. Plan your work by creating a cycle named "Regression Tests for v2.5 Release."
    Test Execution The act of running a test and recording the outcome. Mark a test as "Pass" or "Fail" to track progress and generate reports.
    Test Plan A high-level container that can group multiple cycles. Use a Test Plan to manage the entire testing strategy for a major product launch.
    ZQL Zephyr Query Language, used to search for tests. Find all failed tests in the current sprint with a query like cycleName = "Sprint 3.2 Regression" AND executionStatus = "FAIL".

    Understanding these components allows you to build a structured, traceable testing workflow.

    From Test Execution to Defect Logging

    What do you do when a test fails? Let's say the "Verify user login" test fails because the password field doesn't accept special characters.

    Actionable Tip: Directly from the test execution screen, click "Create Defect." Zephyr automatically links the new bug ticket to the original user story, the failed test case, and the specific test cycle. This creates a perfect audit trail for the developer.

    This tightly linked workflow eliminates guesswork. Anyone on the team can open a user story and instantly see:

    • All test cases covering the feature.
    • The complete execution history for every test run.
    • All defects found during testing.

    This visibility helps teams track quality and identify problem areas. To make this data even more accessible, add Zephyr reporting gadgets to a shared Jira dashboard for a live view of the project's health.

    How to Get Zephyr Up and Running for Your Team

    Successfully implementing Zephyr for Jira requires a solid setup from day one. A well-planned configuration will create an organized, scalable QA process that integrates smoothly into your development cycle. The process starts in the Atlassian Marketplace.

    A Jira administrator can simply navigate to the Atlassian Marketplace, search for Zephyr Squad or Zephyr Scale, and install the app. Afterward, enable it for the specific Jira projects where you intend to manage testing.

    Zephyr for Jira UI settings connecting to API, Selenium, and Cypress testing tools.

    Enabling the app activates all of Zephyr's features within that project, adding the necessary issue types and panels for your team.

    First-Time Project Setup

    With Zephyr enabled, your first action is to configure the project settings. The most critical step is ensuring the "Test" issue type is included in your project's issue type scheme. If you skip this, your team will be unable to create test cases.

    Next, customize your project's screen schemes. Add custom fields to the "Test" issue type to capture data that is important to your team.

    • Priority: Add a "High," "Medium," or "Low" priority field to help focus regression testing on what matters most.
    • Test Type: Create a field to distinguish between "Functional," "UI," "Performance," or "Security" tests for better planning and reporting.
    • Automation Status: Include a field to track whether a test is "Manual," "Automated," or a "Candidate for Automation." This is essential for monitoring your automation goals.

    These custom fields add valuable metadata, making your test repository easier to search, filter, and report on as it grows.

    Organizing Your Test Repository for Long-Term Success

    A common mistake is creating test cases without a clear organizational structure. To avoid chaos, organize your tests into a logical folder structure from the start, mirroring your application's features or modules.

    Actionable Tip: Think of your test repository like a file system. Create top-level folders for major components like "User Authentication," "Payment Processing," and "Admin Dashboard." This makes it easy for anyone to find existing tests, add new ones, and prevent duplicates.

    This simple organizational discipline will save your team countless hours in the long run.

    Tying in Your Automation Frameworks

    To integrate your automated tests, use Zephyr's REST API. This API connects your test scripts with your Jira project, allowing you to push results from frameworks like Selenium, Cypress, or Playwright directly into Zephyr test cycles.

    This integration provides a unified view of all testing activities. In a single Jira test cycle, you can see the results of both manual and automated test runs side-by-side. Configuring this API connection is a critical step toward achieving a modern, efficient QA process.

    Where Zephyr Can Stumble: Common Limitations and Roadblocks

    No tool is perfect, and while Zephyr for Jira excels at integrating testing into development, it has limitations. Understanding these potential challenges allows you to plan around them instead of being caught by surprise.

    A primary concern for growing teams is performance. With tens of thousands of test cases, the user experience can become sluggish. Loading large test cycles or filtering extensive lists of tests can introduce delays, impacting your QA team's productivity.

    Actionable Tip: Any app built inside another platform is constrained by the host's architecture. Zephyr's performance is tied to Jira's. If you anticipate managing over 50,000 test cases, consider running performance tests with a sample project before committing to a full-scale rollout.

    The Challenge of Per-User Licensing

    Zephyr's pricing model can also be a significant roadblock. The license cost, particularly for Zephyr Scale, is often tied to your total number of Jira users, not just your testers. This means developers, product managers, and other team members with Jira licenses could contribute to your Zephyr bill, even if they never write or execute a test.

    This can lead to unexpectedly high costs. Based on user reviews, dedicated QA testers often make up only 10–20% of total Jira users in a company. In this scenario, you could pay 5 to 10 times more than anticipated. These same reviews frequently cite performance issues, with some users reporting that large test suites can take 10–20 minutes to load. You can find a collection of these user-reported insights on aqua-cloud.io.

    Navigating the User Interface

    Finally, while functional, the user interface can feel clunky compared to modern, standalone testing platforms. Some common pain points include:

    • Difficult bulk edits: Updating hundreds of test cases at once requires a cumbersome, multi-step process.
    • Rigid reporting: Standard reports are available, but creating custom, cross-project dashboards often requires exporting data to another tool.
    • Challenging navigation: In large projects, finding a specific test cycle or execution can be time-consuming.

    By evaluating these trade-offs—performance at scale, licensing costs, and UI limitations—you can make an informed decision about whether Zephyr for Jira is the right long-term solution for your team.

    Elevating Your QA with Advanced Workflow Orchestration

    While Zephyr for Jira is excellent for managing test cases, modern QA requires more than just logging results. It requires orchestrating the entire quality process—from code commit to final sign-off. This is where you move from test management to workflow automation, closing the coordination gaps that test management tools alone cannot address.

    Consider the standard handoff: a developer moves a Jira ticket to 'Ready for QA.' This action often triggers a series of manual steps, Slack messages, and status checks. This is a common friction point where context is lost and delays occur. Workflow orchestration automates these handoffs to ensure nothing is missed.

    From Test Management to Process Automation

    This is where a tool like Harmonize Pro's Nesty complements Zephyr. While Zephyr manages the "what" of testing (the test cases and cycles), Nesty orchestrates the "how" and "when" by automating the process around the testing. It acts as an air traffic controller for your quality process.

    For instance, when a ticket is moved to 'Ready for QA', Nesty can enforce your team's standards before testing begins.

    • Enforce a Definition of Ready: Automatically present a checklist to the developer, requiring them to confirm that release notes are attached, unit tests have passed, and deployment instructions are clear before the ticket can be assigned to QA.
    • Automate Handoffs: Once the checklist is complete, automatically reassign the ticket to the appropriate QA engineer, eliminating the manual assignment process.
    • Trigger Notifications: Simultaneously, send a notification to a specific Slack channel to inform the QA team that a new feature is ready for testing.

    Actionable Tip: Shift your quality process from reactive to proactive. Implement a "Definition of Ready" checklist to ensure that by the time a QA engineer receives a ticket, it has already been validated and contains all necessary information.

    Closing the Coordination Gap

    Zephyr provides the library of tests; Nesty builds the intelligent pipeline that governs the processes around them. This creates a resilient quality gate where standards are enforced, reducing rework and miscommunication. To learn how to implement these workflows, explore the guides on how to structure dev-to-QA handoffs with Nesty.

    To further advance your QA strategy, look beyond functional validation. Visual consistency across browsers is a critical aspect of quality that standard test cases often miss. Exploring the best visual regression testing tools can help you catch UI bugs that automated functional tests cannot.

    By combining robust test management with intelligent workflow orchestration, you can build a comprehensive and reliable quality system.

    Practical Use Cases for Zephyr and Nesty

    Combining Zephyr’s structured test management with Nesty’s workflow automation allows you to build powerful quality pipelines directly inside Jira. These three practical scenarios demonstrate how this partnership eliminates manual work and enforces consistent processes.

    These examples show how to build a smart workflow around Zephyr for Jira that prevents messy handoffs and ensures no steps are forgotten.

    Diagram showing Zephyr and Nesty integration for Dev-to-QA, deployments, and bug triage workflows.

    Automated Dev-to-QA Handoffs

    When a developer moves a Jira ticket to "Ready for QA," you can automate the entire handoff process. The moment the ticket status changes, Nesty can trigger a mandatory "Definition of Ready" checklist for the developer.

    Actionable Tip: Use this checklist as a quality gate. The ticket cannot be assigned to QA until the developer confirms that unit tests have passed, documentation is updated, and the code has been deployed to the correct test environment.

    Once the checklist is complete, Nesty can automatically reassign the ticket to the QA lead and link the relevant Zephyr test cycle for execution. The handoff is seamless and fully documented without a single Slack message.

    Managing Multi-Environment Deployments

    Deploying features across Staging, UAT, and Production environments requires careful coordination. Use a nested checklist in Nesty to manage this sequence within a single Jira ticket, linking specific Zephyr test suites at each stage.

    Here’s how to structure the workflow:

    1. Deploy to Staging: A checklist item guides the DevOps engineer through the staging deployment. Upon completion, a Zephyr regression test cycle is automatically linked and assigned for verification.
    2. Deploy to Production: This stage only unlocks after the staging tests pass. The production deployment is then performed, followed by the automatic assignment of a focused Zephyr smoke test suite.

    This approach establishes a validated quality gate for each environment, with the entire process tracked transparently in Jira. You can learn more about building these structured workflows with Nesty by Harmonize Pro.

    Streamlining Bug Triage and Verification

    When QA finds a bug and logs it in Zephyr, automate the fix-and-verify loop. Nesty can create a developer-focused sub-task checklist to guide the process. Include mandatory items like "Identify root cause," "Write a unit test to replicate," and "Submit for peer review."

    Once the developer completes their checklist, the ticket automatically transitions back to the original QA engineer with a notification. This prompts them to re-run the failed Zephyr test case to confirm the fix. This closed-loop process eliminates communication gaps and ensures every bug is properly validated before being closed.

    Zephyr vs. Nesty A Comparison of QA Functions

    This table clarifies how Zephyr and Nesty solve different but related problems within the QA lifecycle. Zephyr is your test library; Nesty is the conductor ensuring the right processes are followed.

    Function Zephyr for Jira Nesty by Harmonize Pro
    Primary Goal Organize, plan, and execute test cases. Orchestrate and enforce workflows across teams.
    Core Asset Test Cases & Test Cycles. Actionable Checklists & Quality Gates.
    Who Uses It? QA Engineers, Test Managers. Developers, QA, DevOps, Project Managers.
    Key Question Answered "Did this feature pass its tests?" "Did we follow the correct process to ship this feature?"

    Zephyr provides the "what" of testing (the test cases), while Nesty provides the "how" and "when" (the workflow). Together, they create a robust and repeatable quality process inside Jira.

    Got Questions About Zephyr for Jira? We've Got Answers.

    Here are quick answers to the most common questions teams have about Zephyr for Jira.

    What's the Real Difference Between Zephyr Squad and Zephyr Scale?

    Zephyr Squad is ideal for agile teams that need a simple way to manage tests within a single Jira project. It's straightforward and easy to adopt.

    Zephyr Scale is designed for larger organizations that require enterprise-level features, such as a centralized, reusable test library that can be shared across multiple projects, advanced reporting, and audit trails.

    Can You Hook Up Automated Tests with Zephyr?

    Yes. Both Zephyr Squad and Zephyr Scale provide REST APIs that allow you to integrate with automation frameworks.

    You can connect tools like Selenium, Cypress, and Playwright to push automated test results directly into your Jira test cycles. This gives you a single dashboard to view results from both manual and automated tests.


    Ready to move beyond just managing tests and start truly orchestrating your quality process? Harmonize Pro's Nesty builds intelligent, automated workflows directly inside Jira to kill manual handoffs and enforce quality gates. Find out how Nesty can help.

  • Solving The Top 5 Issues With Jira Slowing Your Team Down

    Solving The Top 5 Issues With Jira Slowing Your Team Down

    When Jira workflows break down, the first instinct is to blame the tool. But the real issues—chaotic processes, dropped handoffs, and a lack of visibility—almost always trace back to how the tool is used, not the tool itself.

    The good news is that these problems are solvable. This guide provides actionable strategies to fix the most common issues with Jira by embedding quality gates, automating manual work, and creating workflows that produce accurate data by default.

    Why Your Jira Workflows Keep Breaking

    Jira is a powerful platform, but its flexibility is a double-edged sword. Without a clear strategy, teams often create convoluted workflows that cause more friction than they solve. The frustration isn't with Jira's core features; it's with the broken processes built on top of it.

    A workflow that looks perfect on a whiteboard can fall apart under real-world pressure. Manual steps get skipped, critical information is lost between teams, and status updates become an afterthought. These aren't tool failures; they are process gaps that need to be closed.

    The Real Source of Jira Pain Points

    Most common Jira frustrations stem from a few root causes. Here's how to identify them in your own processes:

    • Manual Handoffs: Action Item: Review your "Time in Status" report. Do tickets linger in transitional statuses like "Ready for Review"? This indicates a handoff failure. The solution is to automate notifications and reassignments.
    • Invisible Quality Gates: Action Item: Ask your team if your "Definition of Done" (DoD) is a document or an enforced step in Jira. If it's just a page in Confluence, it’s not a gate. The solution is to build checklists into your workflow transitions.
    • Inconsistent Data Entry: Action Item: Look at five recently closed tickets. Are key fields like 'Story Points' or 'Component' filled out consistently? If not, you have a data entry problem. The solution is to make critical fields mandatory before a ticket can be closed.

    Understanding these points is the first step. For a deeper dive on system-level issues, this guide on identifying performance bottlenecks offers valuable insights.

    Actionable Insight: Shift your mindset from blaming the tool to auditing your process. The moment you start asking "Where does our process allow for human error?" is the moment you can start finding real, lasting solutions.

    Take a look at a typical Jira board. It’s designed to visualize a workflow, showing how tasks move from one stage to the next.

    Each column is a step in the process. When configured well, this board gives you at-a-glance visibility. But if the process it represents is broken, it's just a pretty picture of a traffic jam.

    Diagnosing Your Workflow Issues

    Before you can fix anything, you must identify what's broken. While many teams face similar issues, the symptoms vary. Knowing how to modify your setup is critical; our guide on changing a workflow in Jira provides a step-by-step approach.

    Use this diagnostic table to connect common symptoms to their root causes and identify your first target for improvement.

    Common Jira Problems and Their Root Causes

    This table breaks down the frequent complaints we hear about Jira and points to the underlying process failure that's usually to blame.

    Jira Issue Common Symptom Underlying Cause
    Stalled Tickets Issues sit in one status for days without moving. A failed manual handoff; no one was notified.
    Endless Rework QA constantly sends tickets back to development. Missing quality gates; DoD criteria aren't enforced.
    Inaccurate Reports Metrics and dashboards don't reflect reality. Inconsistent data entry and manual status updates.
    Team Confusion No one is sure who owns a ticket or what's next. An ambiguous workflow design with unclear transitions.

    Once you identify the symptom your team is facing, you can start digging into the process behind it instead of just treating the surface-level issue.

    Fixing Broken Handoffs Between Engineering Teams

    A developer drags a ticket to "Ready for QA," but a crucial piece of information is missing. The notification gets lost in Slack, and the ticket sits idle for days. This isn't just an annoyance; it's a silent project killer that stalls releases and creates friction.

    The good news is that these friction points are entirely fixable. Once you diagnose where the process is failing, you can implement targeted automation to turn painful handoffs into a seamless, reliable workflow.

    This diagram shows the classic domino effect of a broken process—where manual steps lead directly to missed quality checks and, ultimately, bad data.

    Diagram illustrating a broken workflow process: manual work leads to missed checks, resulting in bad data.

    As you can see, every manual step introduces a risk of human error. That risk cascades through the workflow and makes accurate reporting nearly impossible.

    Finding the Breakpoints in Your Handoffs

    To fix the problem, you have to find exactly where things are going wrong. Use Jira's "Time in Status" report to pinpoint bottlenecks. If tickets consistently spend too much time in a transitional status like "Ready for Review," that’s your starting point. It means the ticket is sitting in a queue, invisible to the next person in the chain.

    Actionable Steps to Find Handoff Failures:

    • Audit Assignees: Look at the last 10 tickets that moved from "In Progress" to "Ready for QA." Was the assignee updated immediately? If not, you have an assignee ambiguity problem.
    • Check Notification Channels: Ask your QA team if they rely on email or a general Slack channel for notifications. If so, these messages are likely getting lost in the noise.
    • Review Reworked Tickets: Analyze tickets that were sent back from QA to Dev. What was the reason? Missing pull request links, test credentials, or environment details are clear signs of incomplete handoffs.

    Actionable Insight: A successful handoff isn't just a status change. It's a complete transfer of ownership and context. Your goal should be to ensure the next person has everything they need to start working immediately, without needing to ask for clarification.

    Implementing Concrete Automation Strategies

    Once you’ve identified the breakpoints, you can build a more resilient process with automation. For simple fixes, Jira's built-in automation rules are a great starting point.

    For instance, create this rule: WHEN a ticket is moved to "Ready for Test," THEN automatically assign it to the QA lead and add a comment pinging the QA team's Slack channel. This simple action eliminates the risk of a ticket becoming an orphan in the QA column.

    But many handoff problems are more complex. What if the ticket isn’t actually ready for QA? That’s where you need a more robust solution.

    Using Dynamic Checklists to Enforce Readiness

    One of the most powerful ways to fix broken handoffs is to build your "Definition of Ready" (DoR) directly into the workflow. This isn't a checklist on a Confluence page; it's an interactive, enforceable quality gate.

    Here’s how to implement it: Use a tool like Nesty from Harmonize Pro to trigger a dynamic checklist that blocks a status transition until every DoR criterion is met.

    This checklist can enforce actions like:

    • Unit test results are linked.
    • Code has been peer-reviewed.
    • Deployment notes are complete.

    The ticket literally cannot move forward until each item is checked off. This transforms your DoR from a suggestion into a mandatory, unskippable step, guaranteeing that when a ticket lands in the QA column, it’s truly ready for testing. This level of structure strengthens working relationships between teams. To learn more, check out our guide on how to improve team collaboration.

    Building Quality Gates Your Team Cannot Ignore

    Your "Definition of Done" (DoD) on a Confluence page is often the first casualty of a looming deadline. When pressure mounts, guidelines get ignored, leading to inconsistent quality and rework. This is one of the most persistent issues with Jira—it allows process standards to live outside the actual workflow, making them easy to bypass.

    To fix this, you must build your quality gates directly into the Jira ticket as unskippable checks that stop a ticket until your standards are met.

    Sketch of a development gate with a padlock, showing a checklist with 'Unit Tests Passed' and 'Code Reviewed'.

    Think of it as turning your DoD from a passive document into an active, automated gatekeeper. This guarantees standards are upheld every time, not just when it’s convenient.

    Moving Beyond Suggestion to Enforcement

    A wiki page can't physically stop a developer from moving a ticket. To create a true quality gate, the workflow itself must enforce the rules. This means embedding your criteria as mandatory, interactive elements inside the Jira issue. Instead of just hoping a developer ran all required checks, design a workflow where the "Ready for QA" transition is blocked until a checklist is completed. This is how you transform a suggestion into a non-negotiable step.

    A Practical Example of an Enforceable Quality Gate

    Here's a step-by-step implementation plan:

    1. Identify the Gate: Choose a critical transition, like "In Progress" to "Ready for QA."
    2. Define Your Checklist: List the non-negotiable criteria for this gate. For a pre-QA check, this might include:
      • Unit Tests Passed: Developer confirms all unit tests are green.
      • Code Peer Reviewed: Verifies another developer has approved the code.
      • Deployment Notes Updated: Confirms instructions for deployment are complete.
      • Test Environment Specified: Designates the correct environment for QA testing.
    3. Implement the Block: Use a tool like Nesty to configure a "blocking checklist" on that transition. The ticket is now locked in its current status until every item is checked off. Only then does the transition to "Ready for QA" become available.

    Actionable Insight: This mechanism changes the dynamic completely. Quality is no longer a manual audit; it's an automated, baked-in requirement for moving work forward. The process itself becomes the guardian of your standards.

    The Challenge of Tracking Quality Metrics Natively

    This embedded quality approach also solves another major Jira issue: tracking detailed quality metrics. Natively, Jira struggles to track metrics like test failure rates automatically. Teams using add-ons like Xray for Jira often have to wrestle with manual JQL queries to get this data.

    With Nesty from Harmonize Pro, you can use nested checklists and intelligent triggers to centralize test sequencing and enforce your DoD in one ticket, creating a transparent and auditable trail of quality. You can see how other teams are tackling this challenge in the Atlassian community to understand the common pain points. By building these checks into the ticket, you generate a rich source of data that was previously invisible.

    The Broader Impact on Team Dynamics

    Implementing enforceable quality gates does more than improve code quality—it reduces friction between your teams. When QA receives a ticket, they can be 100% confident it has met all "Definition of Ready" criteria. This ends the frustrating back-and-forth where QA sends tickets back to development for missing information, fostering shared ownership over quality and letting each team focus on what they do best.

    Getting Accurate DevOps Metrics from Jira

    One of the biggest issues with Jira is its inability to produce accurate DevOps metrics without significant manual effort. For many engineering teams, tracking a critical metric like Change Failure Rate (CFR) requires a slow, error-prone process of manually linking incident or bug reports back to the specific deployment that caused them.

    This manual approach doesn't scale. As deployments become more frequent, the odds of a failed deployment being correctly linked to its failure ticket drop dramatically. What you're left with is misleading data that paints a much rosier picture than reality.

    Why Manual Metric Tracking Fails

    Relying on manual ticket linking is like trying to balance your budget with a shoebox of crumpled receipts. It’s unreliable. The root of the problem is a disconnect between the work itself and the data about the work. When a deployment fails, the top priority is fixing the problem, not administrative follow-up in Jira. The crucial link between the deployment ticket and the subsequent bug report is often forgotten.

    This turns your metrics into a reflection of administrative discipline rather than engineering quality. Your CFR isn't tracking how often your changes fail; it’s tracking how often your team remembers to link tickets.

    Embedding the Signal for Better Data

    To get metrics you can trust, you must make data collection a natural byproduct of your workflow, not an extra step. Embed process gates and data collection points directly into your Jira tickets.

    Actionable Strategy: The Single Deployment Ticket

    1. Create a "Deployment" Issue Type: Use a single Jira ticket to manage a feature deployment across all environments.
    2. Build a Multi-Environment Checklist: Inside that ticket, use a tool like Nesty from Harmonize Pro to create a sequential checklist:
      • Deploy to Development
      • Run automated tests in Dev
      • Deploy to Staging
      • Get manual sign-off from QA
      • Deploy to Production
    3. Track Failures as Checklist Items: If a failure occurs, add a checklist item like "Rollback Production Deployment." This action becomes a direct, unambiguous signal of a change failure. It’s logged in real-time, in the context of the original deployment.

    Actionable Insight: When the process and the record-keeping are one and the same, your metrics become accurate by default. You eliminate human error by designing a workflow that cannot proceed without capturing the data you need.

    The Impact of Inaccurate Metrics

    This isn't just an academic problem. One of the biggest issues with Jira is its inability to properly measure Change Failure Rate (CFR). High-performing teams aim for a CFR between 0-15%, but Jira’s lack of out-of-the-box support forces manual linking that breaks at scale. Studies of over 2,000 teams found this process gap contributes to average cycle times of 6 days and 5 hours. You can learn more about how DevOps metrics are benchmarked on atlassian.com.

    When your data is unreliable, you invest in the wrong areas and miss opportunities for improvement. Getting accurate data isn’t about pretty charts; it's about giving your team the real feedback it needs to get better.

    Using Intelligent Automation to Eliminate Manual Work

    A huge portion of the frustration with Jira comes from tedious, manual chores: updating assignees, nudging stakeholders, and transitioning statuses. This "ticket hygiene" is a breeding ground for errors and a direct cause of broken handoffs.

    The solution is to let automation handle the grunt work. By transforming static Jira issues into dynamic, self-managing workflows, you can free your team to focus on value-driven work.

    A sketched flowchart illustrating a 'COMPLETE CHECKLIST' process with steps for automation, notification, and Slack integration.

    To make this happen, you need a solid grasp of what workflow automation can achieve.

    Identifying High-Impact Automation Opportunities

    To start, pinpoint where manual drag is coming from. Look for small, repetitive tasks that eat up time.

    Quick Automation Wins:

    • Automate Handoffs: When a ticket moves to "Ready for QA," automatically reassign it to the QA lead and post a notification in their team's Slack channel.
    • Automate Status Updates: When a developer links a pull request, automatically transition the ticket from "To Do" to "In Progress."
    • Automate Sub-task Creation: When a "New Feature" epic is created, automatically generate standard sub-tasks like "Design," "Development," "QA," and "Documentation."

    Each of these is a potential point of failure that a simple rule can eliminate for good.

    Building Multi-Step Automation Cascades

    True automation power lies in building multi-step cascades that orchestrate an entire process from a single click. This is how you can solve complex issues with Jira by designing a workflow that manages itself.

    Consider a "Customer Onboarding" process. With a tool like Nesty from Harmonize Pro, you can automate the entire sequence.

    Example Onboarding Workflow:
    A project manager completes the "Customer Onboarding Kickoff" checklist item in a Jira ticket. This single action triggers a chain of events:

    1. Create & Assign: Instantly creates three sub-tasks: "Technical Setup" (assigned to the implementation lead), "User Training" (assigned to the support lead), and "30-Day Follow-Up" (assigned to the account manager).
    2. Notify Stakeholders: A message is automatically sent to the account manager's Slack channel, letting them know the kickoff is complete.

    Actionable Insight: By chaining actions together, you turn a simple checklist into a workflow engine. The ticket stops being a passive record and starts actively driving the work forward without manual intervention.

    Slashing Manual Overhead at Scale

    This approach directly attacks the manual overhead that plagues so many teams. The constant need for ticket hygiene and the failure to properly decompose metrics undermine the effectiveness of teams trying to track DORA metrics. Jira wasn't built for productivity measurement; its manual linking requirements crumble as teams grow.

    This overhead is a major reason why cycle times balloon to 6+ days. Nesty solves this by using dynamic workflows with triggers to reassign tickets, notify via Slack/Teams, and attach files at quality gates. It automates handoffs and creates self-managing processes. By removing the human element from repetitive admin, you save time, improve data consistency, and make your entire process more resilient. For more advanced strategies, see our complete guide to Jira workflow automation.

    Frequently Asked Questions About Fixing Jira

    Even with a solid plan, jumping into workflow automation can feel daunting. Here are answers to common questions that teams have when trying to fix what’s broken in their Jira setup.

    Can I Fix These Jira Issues Without Buying a Third-Party App?

    You can make progress on simple problems using Jira’s native automation. For example, setting a rule to auto-assign a ticket to a QA lead or transition an issue when a pull request is merged is straightforward.

    However, built-in tools have limitations. They cannot enforce multi-step, dependent checklists or create the conditional blockers needed for true quality gates. For stubborn issues—like botched handoffs and teams skipping "Definition of Done" criteria—you need a dedicated app designed to fill those gaps and provide dynamic controls that go beyond what Jira offers out of the box.

    Our Biggest Issue With Jira Is Slow Performance. Will These Solutions Help?

    Yes, process improvements can have a surprising impact on performance. A sluggish Jira is often a symptom of overly complex configurations and process bottlenecks, not just server issues. When your team has to manually click through a dozen fields or navigate confusing statuses, the tool itself feels slow.

    By cleaning up your processes, automating handoffs, and simplifying workflows, you reduce the operational drag. The system feels faster and more responsive because your team spends less time waiting for updates or getting lost in the UI.

    How Long Does It Take to Implement These Workflow Improvements?

    You can get results surprisingly fast by starting small. Implementing a simple, automated handoff between Dev and QA can be done in an afternoon. Building a more robust quality gate with a detailed DoD checklist might take a day of focused planning and configuration.

    The secret is to not try to fix everything at once.

    Your 3-Step Action Plan:

    1. Identify your single biggest pain point. For most teams, it’s the Dev-to-QA handoff.
    2. Focus all your energy on solving that one problem first with an automated quality gate.
    3. Demonstrate the win to your team. Once everyone experiences how a foolproof process works, you'll build the momentum needed to tackle larger, more complex workflows.

    Ready to turn your static Jira tickets into self-managing workflows? With Harmonize Pro, you can use Nesty to build enforceable quality gates, automate handoffs, and eliminate the manual work slowing your team down. Learn how Nesty can solve your most frustrating Jira issues today.

  • Boosting Agile Story Acceptance Criteria: A Practical Guide for Teams

    Boosting Agile Story Acceptance Criteria: A Practical Guide for Teams

    Agile story acceptance criteria are the specific, testable conditions a user story must meet to be considered complete. They draw a clear line in the sand, ensuring developers, testers, and product owners share a precise understanding of what "done" means for a feature. Without them, your team operates on assumptions—a fast track to rework, missed expectations, and building features nobody wants.

    Why Clear Acceptance Criteria Are Your Team's North Star

    Imagine this scenario: a team ships a new "user profile update" feature. The developers built it so users could change their display name. But the product owner expected users to also update their email address and profile picture. That simple misunderstanding, born from a fuzzy requirement, just created weeks of frustrating, expensive rework. This is the preventable chaos that erupts when you don't have clear agile story acceptance criteria.

    Agile acceptance criteria document with a compass pointing to achieved goals, and a development team.

    Good acceptance criteria (AC) are more than a checklist; they are the contract between the development team and business stakeholders. They transform a user story from a vague idea into a solid, testable set of requirements.

    The Foundation of Shared Understanding

    When your criteria are well-defined, they become the single source of truth for a story, eliminating the dangerous guesswork that pollutes handoffs between product, dev, and QA. Everyone—from the person writing the code to the person testing it—knows the exact goal. Getting this alignment right is the secret to building the right thing, the first time.

    Actionable Tip: Use your acceptance criteria as a tool to defend against scope creep. When a new request comes in, compare it against the agreed-upon AC. If it doesn't fit, it's a new story. This simple check locks in the 'what' and 'why' and keeps your sprint focused.

    This shared clarity delivers powerful, practical benefits:

    • Reduced Rework: Teams stop building the wrong thing or missing critical functionality, which drastically cuts down on bug-fix cycles.
    • Accurate Estimations: With a precise picture of the requirements, developers can provide more reliable story point estimates.
    • Improved Collaboration: The act of co-writing criteria during backlog refinement sparks essential conversations that uncover edge cases and technical hurdles early. Learn more in our guide on how to improve team collaboration.

    From Ambiguity to Actionable Rules

    Investing time to define these rules upfront is the single most effective action you can take to prevent project delays. It forces stakeholders to think through the details and make decisions before development starts, not after.

    If you want to dig deeper into defining and measuring work against set standards, these actionable guides on assessing competence offer practical frameworks. Ultimately, this structured approach gets every team member pulling in the same direction, guided by a clear and unified purpose.

    Proven Formats for Writing Actionable Acceptance Criteria

    How you frame your agile story acceptance criteria matters as much as the content itself. A consistent, clear format is your best defense against misinterpretation and is key to making requirements genuinely testable. Without structure, you invite ambiguity—the very thing acceptance criteria are designed to eliminate.

    Visualizing 'Given When Then' for agile acceptance criteria: user, shopping cart, and success checkmark.

    The best formats don't just list rules; they guide your thinking. They force the team to walk through the user's interaction, defining the starting context, the action taken, and the specific, observable outcome.

    The Power of Given/When/Then (GWT)

    For describing user-facing behavior, the Given/When/Then format is the gold standard. Often called Gherkin syntax, it tells a miniature story about how a feature should behave from the user's perspective, making it incredibly intuitive for everyone to grasp. As a cornerstone of Behavior-Driven Development (BDD), it bridges the gap between product, development, and QA. This approach also naturally lends itself to creating automated tests. For a deeper dive, explore the details behind the GWT format.

    Let's break it down with a classic e-commerce example:

    • Given: Sets the scene. What is the state of the system before the user acts?
      • Example: Given I am a logged-in user with two items in my shopping cart.
    • When: The specific action or trigger initiated by the user. It should be a single, clear event.
      • Example: When I click the "Proceed to Checkout" button.
    • Then: Describes the observable, verifiable outcome. What changes to prove the feature worked?
      • Example: Then I am taken to the shipping details page and my two items are listed in the order summary.

    Actionable Tip: If your team struggles to agree on the "Given," stop immediately. It’s a red flag that the user's starting point is undefined. Resolve that ambiguity before writing any more criteria.

    Rule-Oriented Checklists

    While GWT is brilliant for user journeys, it can be cumbersome for other types of requirements. This is where a simple, rule-oriented checklist excels. This format is a straightforward list of conditions that must be met.

    It’s the perfect tool for:

    • Non-Functional Requirements: Performance targets (e.g., API response must be <100ms) or security rules.
    • Technical Stories: Tasks like setting up a new database or configuring a CI/CD pipeline.
    • UI/UX Details: Pinpointing design constraints, like specific hex codes, font sizes, or exact wording for validation messages.

    Here’s how to apply it:

    User Story: As a user, I want to create a secure password for my account.

    Acceptance Criteria (Checklist Format):

    • Password must be a minimum of 12 characters.
    • Password must contain at least one uppercase letter.
    • Password must contain at least one number.
    • Password must contain at least one special character (e.g., !, @, #, $).
    • A real-time strength indicator must update as the user types.

    Which Format Should You Choose?

    Deciding between GWT and a checklist isn't about finding a single "best" method; it's about choosing the right tool for the job. The correct format enhances clarity, while the wrong one adds confusion.

    This table provides a practical breakdown to guide your team's decision.

    Acceptance Criteria Format Comparison

    Format Type Best For Advantages Potential Drawbacks
    Given/When/Then (GWT) User-facing features, complex workflows, and behavior-driven scenarios. – Promotes clear, story-like thinking.
    – Aligns product, dev, and QA.
    – Excellent for test automation (BDD).
    – Can be overly verbose for simple rules.
    – Awkward for non-functional or technical requirements.
    Rule-Oriented Checklist Technical stories, non-functional requirements (NFRs), UI design rules, and simple validation. – Concise and easy to scan.
    – Great for atomic, independent rules.
    – Flexible for a wide range of criteria.
    – Lacks narrative context.
    – Can lead to a long, disconnected list of rules if not managed well.

    Actionable Insight: Don't force one format on every story. Empower your team to use GWT for user-facing logic and checklists for technical or design constraints, even within the same user story. This flexibility leads to clearer, more effective criteria.

    Common Mistakes That Undermine Your User Stories

    Having bad acceptance criteria is worse than having none at all. Ambiguous or poorly written criteria create a false sense of security, leading the team down a path of wasted effort and features that completely miss the mark. To improve, first learn to spot these common anti-patterns.

    Dictating the "How" Instead of the "What"

    A frequent mistake is writing criteria that spell out the technical implementation for the development team. This fundamentally misunderstands the purpose of a user story. It stifles creativity, often locks in a subpar solution, and puts the focus on the how instead of the what.

    Actionable Guideline: Good acceptance criteria must describe an observable outcome from the user's perspective. This empowers your engineers to find the best, most efficient way to achieve that outcome.

    What Not to Do (Too Prescriptive):

    • When the user clicks the "Save" button, a JavaScript function called updateProfile() is triggered, which sends a POST request to the /api/user/profile endpoint.

    A Better Way (Outcome-Focused):

    • When the user clicks the "Save" button, their updated profile information is successfully stored and reflected on the profile page.

    The second example is testable from a user's perspective. The first is a premature technical decision that doesn't belong in the story's criteria.

    The Pitfall of Vague and Untestable Criteria

    Another classic error is writing criteria that you can't actually verify. Phrases like "the page must be fast" or "the design should be user-friendly" are subjective and untestable. What's "fast" to one person might be painfully slow to another. A developer cannot build to a feeling, and a QA engineer cannot test it.

    Actionable Test: If you cannot write a definitive pass/fail test case for a criterion, it needs to be rewritten. This simple check is your best defense against ambiguity and prevents conflict during sprint reviews.

    What Not to Do (Vague):

    • The search results page must load quickly.

    A Better Way (Specific & Testable):

    • The search results page must load and display all content in under 2 seconds on a standard broadband connection.

    By adding a measurable target, "quickly" becomes a clear, actionable goal. This clarity is essential for effective test planning. For more on this, check out our guide on managing test cases in Jira.

    The Overloaded User Story

    If a user story has a list of 10 or more acceptance criteria, that’s a major red flag. You don't have a story; you have an epic in disguise. These massive stories are a nightmare to estimate, build, and test thoroughly in one sprint.

    Actionable Rule of Thumb: If a user story has more than five to seven acceptance criteria, hold a team discussion about splitting it. Breaking it into smaller, more focused stories creates faster feedback loops, reduces risk, and enables you to deliver tangible value within a single sprint. You can read more about how this improves product development cycles on uxplanet.org.

    Avoiding these common mistakes will instantly elevate the quality of your backlog and help ensure every sprint delivers clear, well-defined value.

    Building Quality Gates with Acceptance Criteria in Jira

    To make great acceptance criteria a non-negotiable part of your workflow, integrate them directly into your team's daily tool: Jira. Instead of relying on manual checks, you can configure Jira to act as a quality gate, making it impossible for a story to progress without solid agile story acceptance criteria.

    This process starts before a sprint even begins, with a strong Definition of Ready (DoR). A DoR is a simple pact within your team: a user story must meet specific standards before it can be considered for a sprint. This prevents vague ideas from derailing sprint planning and forces crucial conversations to happen early.

    Establishing Your Definition of Ready

    Your DoR acts as the gatekeeper for your sprint backlog, ensuring every story that gets in is clear, actionable, and ready for development.

    A solid DoR, enforced directly within your Jira workflow, can be a simple checklist:

    • The story is clearly written and understood by the team.
    • Acceptance criteria are defined and testable. (This is the core of the DoR).
    • Dependencies are identified and resolved.
    • The story has been estimated by the development team.

    A diagram illustrating three common pitfalls to avoid in an AC process flow: vagueness, difficult implementation, and excessive criteria.

    A formal DoR helps you sidestep common pitfalls like vague goals or overly prescriptive details, catching these issues before they waste development time.

    Automating Quality Gates and Handoffs

    Manually checking a DoR for every story is tedious, and items will inevitably slip through. This is where you let Jira do the heavy lifting. Imagine a workflow where a story is blocked from moving from 'To Do' to 'In Progress' until its acceptance criteria are confirmed.

    Tools like Nesty for Jira by Harmonize Pro are designed for this. Nesty lets you create detailed checklists within a Jira issue and then build automation rules based on them. Your static criteria become a living, enforceable quality gate. For a step-by-step walkthrough, see this guide on building a powerful checklist in Jira.

    Actionable Strategy: Automate your DoR checks in Jira. You're not just enforcing a process; you're embedding quality into your workflow. Every step becomes auditable, ensuring standards are met consistently without relying on memory.

    This automation extends beyond the start of the process. Consider the handoff from development to QA—a classic point of friction. With an app like Nesty, you can set up a rule that triggers as soon as a developer completes their "Development Complete" checklist.

    The moment that happens, the story can be automatically:

    1. Reassigned to the designated QA engineer.
    2. Moved to the 'Ready for QA' column on your board.
    3. A notification is sent to the QA team's Slack or Teams channel.

    This creates a seamless handoff that eliminates manual steps and idle time. It guarantees that the QA team only receives work that has verifiably met all its acceptance criteria, transforming Jira from a simple task board into a smart system that actively defends quality.

    The Future of AI in Validating Acceptance Criteria

    Emerging technology is set to transform how we validate acceptance criteria. We are moving from manual reviews toward a future where AI can scan our criteria for clarity, completeness, and hidden conflicts before development begins. This represents a major shift from reactive quality checks to proactive, intelligent validation.

    This evolution is driven by machine learning algorithms that can learn from your team's historical data. Imagine an AI that has analyzed thousands of your past user stories. It learns what "good" criteria look like in your context, identifies common patterns of ambiguity, and flags criteria that are too vague to be testable.

    From Manual Checks to Predictive Insights

    The true game-changer is predictive power. Research on machine learning in Agile has shown that certain models can validate criteria compliance with high accuracy. This allows teams to move from tedious manual reviews to AI-assisted validation, where technology highlights which criteria are most critical for success. You can explore the research on machine learning applications in Agile workflows for more details.

    Practical AI applications on the horizon:

    • Predicting Edge Cases: AI could analyze a story's context and suggest missing acceptance criteria that even a seasoned product owner might overlook.
    • Ensuring Testability: It could automatically flag subjective words like "fast" or "user-friendly" and prompt for concrete, measurable metrics.
    • Identifying Conflicts: It could spot contradictory criteria between two related user stories, catching a potential integration nightmare before it happens.

    As this technology evolves, the broader practice of AI-powered knowledge management becomes essential, as these systems rely on high-quality project data to learn.

    Actionable Insight: This isn't about replacing the critical conversations between team members. It's about augmenting them. AI can handle repetitive, pattern-matching work, freeing up your team to focus on creative problem-solving and innovation.

    Preparing Your Team for an AI-Powered Future

    How do you prepare your team for this future? It all comes down to your data hygiene today.

    The performance of any future AI model will depend entirely on the quality and consistency of the information you feed it. The process discipline you build now will pay massive dividends later.

    By implementing a structured process for your agile story acceptance criteria now—using tools like Nesty to enforce a clear Definition of Ready and ensure criteria are consistently formatted—you are building the high-quality dataset that will train these future AI systems. Every well-defined story becomes a valuable piece of training data, future-proofing your team’s agile practices.

    Answering Common Questions About Acceptance Criteria

    Even experienced teams encounter the same questions about agile story acceptance criteria. Let's clarify the most common points of confusion to keep your team aligned and productive.

    Who's Actually Responsible for Writing Acceptance Criteria?

    While the Product Owner (PO) is ultimately accountable for the "what" and "why," writing acceptance criteria is a collaborative act, not a solo mission. The best results emerge from a team effort.

    Actionable Process: Write acceptance criteria together during backlog refinement sessions.

    • The Product Owner brings the business goals and user perspective.
    • Developers identify technical constraints and suggest efficient implementation paths.
    • QA Testers excel at spotting edge cases and ensuring every criterion is verifiably testable.

    This collaborative "three amigos" approach ensures that the resulting criteria are valuable, feasible, and testable from the start.

    What's the Difference Between Definition of Done and Acceptance Criteria?

    This common point of confusion trips up many teams. They sound similar but serve distinct purposes.

    • Definition of Done (DoD): A universal quality checklist that applies to all user stories.
    • Acceptance Criteria (AC): Specific rules that apply to only one user story.

    Actionable Analogy: Think of it like this: your DoD is the factory's final quality inspection that every car must pass (e.g., brakes work, engine starts). The AC are the specific features for one particular car order (e.g., color is blue, has leather seats).

    Your Definition of Done includes items like "Code is peer-reviewed," "Unit tests pass with 90% coverage," and "Documentation is updated." A story is not truly finished until it meets both its unique AC and the team's universal DoD.

    Can We Change Acceptance Criteria After a Sprint Has Started?

    Ideally, no. Acceptance criteria should be locked down before a story enters a sprint. Changing them mid-sprint is a primary cause of scope creep and jeopardizes the sprint goal.

    If a stakeholder realizes something crucial was missed, the correct agile response is to create a new user story for that requirement and prioritize it for a future sprint. This protects the team from disruption and keeps delivery predictable.

    Small clarifications are acceptable, but any change that alters the scope or effort requires a new story. This discipline is essential for maintaining a stable and productive workflow.


    Ready to turn your acceptance criteria into automated quality gates? With Harmonize Pro, you can use Nesty to build enforceable checklists in Jira, ensuring your Definition of Ready is met every time. Learn how to build smarter workflows with Nesty.

  • A Practical Guide to the Definition of Done in Agile Methodology

    A Practical Guide to the Definition of Done in Agile Methodology

    In agile development, the Definition of Done (DoD) is your team's shared quality contract. It's an actionable checklist that confirms a task meets every standard before it's called "done." This isn't just about finishing code; it’s a formal agreement that moves work from 'in progress' to genuinely 'complete,' eliminating ambiguity and ensuring everyone is aligned.

    What Is a Definition of Done and Why Does It Matter?

    A chef checks a list of criteria including 'Shippable increment,' illustrating the Definition of Done.

    Imagine a busy restaurant kitchen. Before any dish goes out, the head chef ensures it's cooked perfectly, plated correctly, and garnished just right. This guarantees every customer receives the same high-quality meal. Your team's Definition of Done (DoD) provides that same quality guarantee for your product.

    It’s the team’s collective agreement on what it means for a user story or task to be truly finished. This simple concept stops a developer from claiming, "I'm done," when the code hasn't been tested, documented, or merged. Instead, "done" becomes a tangible state: the code is written, peer-reviewed, has passed all tests, is documented, and successfully integrated.

    The Real-World Impact of a Clear DoD

    We’ve all experienced the "it's done, but…" scenario. This is the direct result of a missing or weak DoD. Work gets handed off, only to be rejected because it fails to meet unspoken expectations. This is a direct path to friction, rework, and missed deadlines.

    A strong Definition of Done turns fuzzy goals into a concrete, verifiable checklist. It becomes the team's single source of truth, aligning developers, QA, and product owners so that what gets delivered is always what was expected.

    This alignment has a measurable impact. Agile teams without a clear DoD often see 20-30% of their work return as rework. Conversely, teams that enforce a robust DoD report sprint completion rates jumping by as much as 47%, boosting overall output by 25%.

    Why It's a Foundational Practice

    At its core, a DoD builds a reliable engine for delivering value. It’s one of the most effective strategies to improve team productivity because it creates a foundation of trust and predictability.

    Here are the actionable benefits a solid DoD provides:

    • Builds Quality In: It prevents bugs and technical debt by ensuring every feature meets a non-negotiable quality bar from the start.
    • Aligns Expectations: It eliminates assumptions and ensures everyone—from junior developers to senior stakeholders—shares the same definition of "complete."
    • Improves Forecasting: When "done" means the same thing every time, sprint planning and release forecasting become dramatically more accurate.
    • Increases Transparency: Stakeholders gain confidence in what they're receiving, which fosters better communication and trust.

    The Building Blocks of a Powerful Definition of Done

    An effective Definition of Done (DoD) is more than a to-do list; it's a shared quality contract. It’s the team’s collective promise that work is actually finished, not just "code complete."

    Like a house needs a solid foundation, a strong DoD is built on essential characteristics. These pillars transform a vague idea of "completeness" into a concrete, reliable standard that everyone can execute against.

    A pyramid of criteria blocks: Agreed, Testable, Measurable, Clear, with people on top.

    This approach delivers tangible results. A 2022 Scaled Agile Framework (SAFe) survey of 500 Agile Release Trains found that teams with a consistent definition of done in agile methodology saw a 28% drop in integration failures. You can dive deeper into these core agile principles on the Agile Alliance website.

    The Four Essential Characteristics

    To create a DoD that works, ensure it has four non-negotiable traits. Each one builds on the last, creating an airtight agreement that prevents confusion.

    • Clear and Unambiguous: Use language so straightforward that a new team member can understand it instantly. Avoid vague terms like "tested" or "reviewed." Be specific: "Automated unit tests passed with 90% code coverage" or "Peer-reviewed by two other developers."

    • Measurable and Verifiable: Every item on your DoD checklist must have a clear pass/fail outcome. "Documentation updated" is weak. "User guide updated with new screenshots and a 'how-to' section" is verifiable and actionable.

    • Testable and Demonstrable: The team must be able to prove each criterion has been met. This could be showing a passed test suite, demoing the feature live to the Product Owner, or pointing to a merged pull request with required approvals.

    • Unanimously Agreed Upon: This is crucial. The entire team—developers, QA, product owners, designers—must build and commit to the DoD together. If it's dictated from management, it will fail. It must be a team-owned document.

    Expanding Your DoD Beyond Just Code

    A common mistake is making the DoD a developer-only checklist. A truly comprehensive Definition of Done covers the entire lifecycle of a user story, ensuring every aspect of the work is genuinely finished.

    A mature DoD acts as a quality gate for more than just code. It ensures that testing is complete, documentation is ready, and the feature is prepared for deployment, guaranteeing that "done" means ready to deliver value.

    To build a more robust checklist, structure your criteria across different domains.

    1. Code and Build Quality:

    • Code peer-reviewed and merged into the main branch.
    • Static code analysis checks pass without critical errors.
    • The feature builds successfully on the continuous integration server.

    2. Testing and Validation:

    • Unit and integration tests are written and passing.
    • Product Owner has verified all acceptance criteria are met.
    • QA has signed off after completing manual and exploratory testing.

    3. Documentation and Readiness:

    • End-user documentation and release notes are updated.
    • Technical documentation (e.g., API specs) is complete.
    • The feature is deployable with a single command or button click.

    Crafting Your DoD With Real-World Checklist Examples

    Knowing the theory behind the definition of done in agile methodology is one thing; putting it into practice is another. The most effective way to make a DoD useful is to build it as a series of practical checklists that scale with the work. A simple bug fix shouldn't face the same hurdles as a major feature release.

    An effective DoD isn’t a monolithic document. It's a living set of standards that adapts to the task's scope. This tiered approach prevents teams from getting bogged down on small jobs while ensuring major releases are rock-solid.

    A Tiered Approach to DoD Checklists

    Your DoD should be like a builder's blueprint—you use different plans for a single room versus the entire building. Let's break down three actionable tiers—User Story, Sprint, and Release—to see how the quality checks build on each other.

    Example DoD for a User Story

    This is the most detailed level, focused on a single piece of functionality. The goal is to confirm this one piece is built correctly and ready for integration.

    • Code Complete: All code is written and adheres to the team's coding standards.
    • Peer Review Passed: At least one other developer has reviewed and approved the code. To build a solid review process, use a guide like The Ultimate Code Review Checklist.
    • Unit Tests Written and Passing: Automated unit tests cover the new code and meet the team's minimum of 85% code coverage.
    • Acceptance Criteria Met: The Product Owner has confirmed the feature functions as required.
    • Code Merged to Main Branch: The feature branch is successfully merged into the main or develop branch without conflicts.

    Scaling Up to a Sprint-Level DoD

    At the end of a sprint, "done" means the entire package of work functions together as a cohesive, potentially shippable product increment. This DoD layer adds checks focused on integration and stakeholder sign-off.

    • All User Story DoDs Met: Every story committed to in the sprint has met its individual DoD.
    • Integration Testing Passed: All new features work together without introducing new bugs.
    • Regression Testing Complete: The automated regression suite has run, confirming existing functionality remains unbroken.
    • Sprint Demo Completed: The team has demonstrated the new functionality to the Product Owner and key stakeholders.
    • Product Owner Sign-Off: The Product Owner has formally accepted the entire sprint's output.

    A sprint-level DoD is the quality gate that transforms individual features into a valuable, working product increment. It shifts the focus from "did we build the pieces right?" to "did we build the right pieces together?"

    The Final Gate: A Release-Level DoD

    This is the final checkpoint before pushing a new version to customers. The focus here widens to include performance, security, and operational readiness.

    • All Sprint DoDs Met: The work from all sprints in the release meets the sprint-level DoD.
    • Performance and Load Testing Passed: The application holds up under expected and peak user loads.
    • Security Scan Completed: A security audit is done, and no high-priority vulnerabilities exist.
    • User Documentation Updated: All help guides, FAQs, and release notes are written and published.
    • Go-Live Plan Approved: The deployment plan has been reviewed and signed off by all relevant parties (e.g., DevOps, leadership).

    By structuring your definition of done in agile methodology across these tiers, you create a clear path to quality. This makes processes like managing test cases in Jira much more straightforward. This layered approach guarantees every detail is checked at the right time, leading to a smoother, more reliable delivery cycle.

    Common DoD Mistakes and How to Avoid Them

    Even with the best intentions, teams often make mistakes when first implementing a Definition of Done. The good news is these pitfalls are common and avoidable. Recognizing these anti-patterns early allows you to correct course before they derail your team. The key is to treat your DoD as a living agreement that helps everyone get work across the finish line, not a rigid set of laws.

    The "Boil the Ocean" DoD

    One of the most frequent mistakes is creating a DoD that’s too ambitious. A checklist that is too long or perfect is nearly impossible to complete within a sprint. This leads to missed sprint goals or, worse, teams cutting corners, which defeats the purpose.

    How to Sidestep This:

    • Start small and iterate. Begin with a simple, achievable DoD covering the absolute must-haves.
    • Use your retrospectives. Regularly discuss the DoD. Ask the team, "Which item on this list saved us last sprint? Which one created unnecessary friction?" This lets you refine your DoD based on real-world experience.

    Your Definition of Done should be a tool that empowers your team, not a cage that makes it impossible to ship. Aim for steady improvement, not immediate perfection.

    The Top-Down Mandate

    A Definition of Done forced on a team without their input is destined to fail. If developers and QA engineers don't help create the standards they're measured against, they won’t feel any ownership. The DoD becomes just another piece of bureaucratic red tape.

    To get genuine buy-in, the entire team—developers, testers, and product owners—must build the DoD together. This fosters a culture of shared responsibility.

    The "Set It and Forget It" Artifact

    A common failure is when a team crafts the perfect DoD, then files it away in a digital folder, never to be seen again. As soon as a sprint gets stressful, that forgotten checklist is the first thing to be ignored.

    To make your DoD effective, you must integrate it into your team’s daily workflow.

    How to Make It Stick:

    1. Keep it visible. Post your DoD checklist where everyone sees it, like a physical whiteboard or the team’s digital dashboard.
    2. Discuss it daily. Reference DoD criteria during stand-ups, especially when a story is nearing completion.
    3. Integrate it into your tools. Use a tool like Jira to add the DoD as a checklist template to every user story. This makes it impossible to ignore.

    By avoiding these common mistakes, your Definition of Done can transform from a static document into a dynamic guide that strengthens alignment, boosts quality, and ensures that "done" truly means done.

    Bringing Your DoD to Life in Jira

    A Definition of Done that exists only in a Confluence page is a suggestion, not a standard. To make it effective, you must weave it directly into your team's daily workflow. For teams using Jira, this means turning your DoD from a passive list into an active, unskippable quality gate.

    By building your DoD right into Jira, you create a system that upholds your standards and makes handoffs between team members smooth and predictable. The goal is to make doing things the right way the easiest way.

    Start Simple: Manual Enforcement in Jira

    Before automating, build solid habits using Jira's native features. The most effective starting point is an issue checklist. Add your DoD criteria as a checklist to your Jira issue templates, making it an unmissable part of every task.

    This manual approach provides immediate benefits:

    • Total Visibility: The entire team sees the exact requirements to complete a task, directly within the ticket.
    • Clear Accountability: Team members must physically check off each item, creating a simple but effective record of completion.
    • Built-in Consistency: Every user story starts with the same quality expectations, reducing "one-off" exceptions.

    For a detailed guide on this, learn how to set up a powerful checklist in Jira. It's a foundational step toward a more airtight, automated system.

    The Real Game-Changer: Automated Quality Gates

    Manual checklists are a great start, but they can be skipped. True enforcement comes from automation. Specialized Jira apps like Nesty from Harmonize Pro allow you to build quality gates that physically prevent tickets from moving forward until every DoD criterion is met.

    Imagine a developer tries to move a ticket from "In Progress" to "Ready for QA." With an automated DoD, Jira blocks the status change until every item on the developer’s checklist is complete. It’s no longer a suggestion; it's a hard rule embedded in the workflow.

    This is critical for breaking the common failure cycle many teams experience with their DoD.

    A flowchart illustrating DoD acquisition pitfalls: Too Ideal, Forced, then Abandoned, in a cycle.

    As shown, a DoD that is too idealistic or forced on the team is often abandoned. Automated enforcement breaks this cycle permanently.

    Automation turns your Definition of Done from a "should do" into a "must do." It shifts quality control from individual discipline to the process itself, ensuring nothing falls through the cracks—even during a crunch.

    Automating Handoffs, Artifacts, and All the Details

    True automation goes beyond blocking a status change. A properly configured system can trigger a sequence of events as soon as the final DoD item is checked.

    For example, once the checklist is complete:

    1. The ticket can be automatically reassigned from the developer to the lead QA engineer, eliminating manual handoffs.
    2. A notification can be instantly sent to the #qa-team Slack channel, informing them a story is ready for review.
    3. The system can verify that required artifacts, like a link to a build log or test plan, are attached before allowing the handoff.

    This automation creates a direct, tangible link between your Definition of Done and your team's output, saving time and guaranteeing process adherence.

    For teams on Jira, using an app like Nesty to build these automated gates can significantly reduce Dev-to-QA handoff times, often by as much as 40%, by ensuring all required information is present from the start.

    By integrating your DoD into your daily tools, you create a self-policing system that defends quality, reduces manual check-ins, and keeps the entire team synchronized.

    How to Evolve Your DoD for Continuous Improvement

    A great Definition of Done is not static. Treat it as a living document that grows with your team, adapting to new challenges and becoming more effective over time. The real power of a DoD is unlocked when it becomes a central part of your continuous improvement cycle.

    This evolution is driven by feedback. Just as you monitor an application's performance, you must monitor your process performance. Tracking the right metrics provides a data-backed view of how well your DoD is working.

    Using Metrics to Measure Your DoD’s Effectiveness

    To determine if your DoD is helping or hindering, focus on outcomes. A few key metrics act as powerful health indicators for your quality gates.

    Track these metrics:

    • Escaped Defect Rate: How many bugs are found in production after a release? A high or rising rate signals your DoD is missing critical quality checks.
    • Sprint Rework: How much time is spent fixing work that was marked "done" in a previous sprint? If this is increasing, your DoD may be too weak.
    • Team Velocity Trends: While not a direct quality measure, volatile or declining velocity can indicate friction. An overly cumbersome DoD can slow the team down.

    The Sprint Retrospective: Your DoD’s Best Friend

    The most important venue for evolving your definition of done in agile methodology is the sprint retrospective. This is the team's dedicated time to inspect and adapt its processes.

    A DoD that isn't discussed in retrospectives is a DoD that will eventually be ignored. Make it a recurring topic to ensure it remains relevant, valuable, and owned by the entire team.

    To facilitate a productive discussion, ask specific, actionable questions about your DoD.

    Questions to ask in your retrospective:

    • Which DoD item created more friction than value this sprint?
    • Where did our DoD save us from potential issues or bugs?
    • Is there a quality check we keep missing that should be added to our DoD?
    • Did we have to bend any rules in our DoD to get work done? If so, why?

    These discussions are fundamental to improving team collaboration. Strong processes are a cornerstone of a culture of quality. Explore more ideas in our guide on how to improve team collaboration.

    The insights gained empower your team to make iterative improvements, ensuring your DoD reflects the team's growing maturity. Implementing a multi-level DoD across user stories, sprints, and releases can accelerate this effect. Data shows this approach can lead to a 47% productivity spike and get products to market 50% faster by preventing incomplete work from moving forward. You can discover more insights on the impact of a strong DoD.

    Common Questions About the Definition of Done

    Implementing a process like the Definition of Done often raises questions. Answering them is crucial for building team confidence and ensuring the process sticks. Here are some of the most common questions and their actionable answers.

    Who Is Responsible for Creating the DoD?

    The short answer: the entire team.

    While a Scrum Master or Product Manager might initiate the conversation, the DoD must be a collaborative effort. If it is mandated by management, developers and QA will feel no ownership, and the process will likely be ignored.

    The most effective DoD emerges from a workshop where everyone involved in building the product contributes. This ensures the criteria are realistic, comprehensive, and supported by the people who will use it daily.

    How Often Should We Update Our DoD?

    Treat your Definition of Done as a living document. The best time to revisit it is during every Sprint Retrospective. This regular cadence allows the team to make adjustments based on recent experiences.

    A DoD that never changes is a DoD that's probably being ignored. It must evolve with the team's skills, the project's complexity, and the lessons learned from previous sprints to remain a valuable tool.

    Ask specific questions during retrospectives: "Did our DoD prevent any bugs last sprint?" or "Is any part of our DoD slowing us down unnecessarily?" These conversations keep your quality standards high and your process relevant.

    Can Different Teams Have Different DoD Checklists?

    Yes, they absolutely should. While an organization might have a high-level quality standard, the specific details of "done" will vary significantly between, for example, a backend API team and a front-end mobile team.

    Forcing a one-size-fits-all DoD across an entire engineering department leads to frustration. The goal is consistency in quality, not uniformity in process. Empower each team to define what "done" means for their context to achieve better results and a DoD that people actually use.


    Ready to stop chasing down updates and start enforcing your quality standards automatically? Harmonize Pro's Nesty app for Jira turns your Definition of Done into an automated, unbreakable workflow. Build quality gates, eliminate manual handoffs, and ensure every ticket meets your criteria before it moves forward. Learn how Nesty can bring true process control to your team at https://harmonizepro.com/nesty.

  • A Guide to Change Issue Type Jira Without Breaking Your Project

    A Guide to Change Issue Type Jira Without Breaking Your Project

    Ever created a Jira ticket as a simple Bug, only to realize it's actually a full-blown Feature request? It happens all the time. Knowing how to change an issue type in Jira is a core skill for keeping your projects organized and your data trustworthy. This isn't just about correcting a simple mistake; it's about making sure your backlog accurately reflects the work to be done.

    Why and When to Change a Jira Issue Type

    A drawing illustrating a bug evolving into a misclassified idea, suggesting an issue type change.

    Changing an issue's type is more than administrative cleanup; it directly impacts your team's workflow, reporting accuracy, and project clarity. A misclassified issue introduces confusion and can disrupt your development cycle.

    Consider a common scenario: a customer reports a UI glitch, and you log it as a "Bug." During investigation, the team discovers it's a symptom of a deeper architectural flaw requiring significant development. The issue is now a "Story" or even an "Epic." If you leave it classified as a "Bug," you misrepresent the required effort, which will throw off your sprint planning.

    Common Triggers for an Issue Type Change

    You'll need to change a Jira issue type in a few common situations:

    • Scope Creep: A simple "Task" to update documentation reveals the need for new functionality, requiring a change to a "Story."
    • Initial Misclassification: A team member quickly logs an issue and selects the wrong type—a frequent and honest mistake.
    • Promoting Sub-tasks: A "Sub-task" grows in complexity and must be tracked as a standalone work item, requiring promotion to a "Task" or "Story."

    This is a recurring challenge in agile environments. In fact, a surprising 35% of all tickets end up needing a type change within their first week. Digging into Atlassian Community discussions shows that for teams managing over 10,000 issues a month, misclassifications cause 42% of all workflow disruptions, which can drag down sprint velocities by an average of 18%.

    Maintaining the correct issue type isn't just about good housekeeping. It ensures that your team's velocity charts, cycle time reports, and project health dashboards reflect reality, enabling better forecasting and decision-making.

    These adjustments are a normal part of agile development. As you learn more, it's helpful to explore the agile product development process to see how these small changes fit into the larger picture of delivering value.

    The Essential Permissions for a Smooth Transition

    Ever tried to change an issue type in Jira, only to find the option greyed out or missing? That's a classic permissions problem. Attempting this change without the right access is like trying to rearrange furniture in a locked room.

    To get started, your account needs a specific set of permissions for the project. In Jira's terminology, changing an issue's type is a "Move" operation, even if it stays in the same project. Understanding the exact permissions required helps you solve access issues quickly.

    The Two Core Permissions You Need

    To switch an issue's type, your role in the project must have two fundamental permissions. Without both, you're stuck.

    • Move Issues: This permission grants access to the 'Move' wizard, which is Jira's tool for changing an issue's type or moving it between projects.
    • Edit Issues: Even if you're not changing the summary or description, altering the issue type is a core modification. This permission is essential for the process.

    If you encounter an access wall, be specific in your request to your admin. Ask: "Could you please grant me 'Move Issues' and 'Edit Issues' permissions for the 'Dragonstone' project?" This clarity gets you a faster solution.

    Think of it like a two-key system for a safe deposit box. The 'Move Issues' permission gets you into the room, but you need the 'Edit Issues' permission to actually open the box and change what's inside. You absolutely need both.

    Beyond Permissions: The Hidden Prerequisites

    Having the right permissions is only the first step. Many users get blocked by configuration mismatches between the original and target issue types, which can trigger confusing error messages.

    A frequent blocker is an incompatible workflow status. For example, if your 'Bug' is in "Code Review" status, but you try changing it to a 'Story' whose workflow lacks that status, Jira will halt. You will be prompted during the move process to map the old status to a valid one in the new workflow.

    Another common obstacle is a field configuration mismatch. If your 'Bug' requires a custom field like "Root Cause Analysis" that doesn't exist on the 'Story' screen, Jira will stop you. You must decide what to do with that field's data before proceeding. Anticipating these mapping conflicts will save you significant time and frustration.

    How to Change a Single Issue Type in Jira

    When you need to change the type of a single issue, your go-to tool in Jira is the Move operation. While the name might seem odd—you're not always moving it to another project—Jira's "Move" wizard is the designated tool for any major change to an issue's core attributes, including its type.

    Let’s walk through a practical scenario. A customer reports an unexpected behavior, so a "Bug" ticket is created. After investigation, you realize it's a request for a new feature. The "Bug" must become a "Story."

    Finding and Using the Move Issue Wizard

    First, open the issue you want to convert. In the top-right corner, click the actions menu (three dots ) and select Move from the dropdown. This action launches Jira’s multi-step wizard to guide you through the process.

    The first screen asks for the new project and issue type. Since you are only changing the type, keep the project the same and select "Story" from the New Issue Type dropdown menu. Click Next to proceed.

    This is the standard Jira issue view where you'll find the actions menu to start the whole process.

    From here, you have access to all the key functions for managing an issue, but the one we need right now is Move.

    Mapping Statuses from One Workflow to Another

    This next step is critical. Different issue types often use different workflows. Your "Bug" workflow might have statuses like Triage, Fix in Progress, and Ready for QA. In contrast, your "Story" workflow might be simpler, with Backlog, In Progress, and Done.

    Jira requires you to map the current status to a valid one in the new workflow. If your "Bug" was in Ready for QA, you must map it to an equivalent status for a "Story"—likely In Progress or Done. Use the dropdown menu for the issue's current status to select the most logical equivalent.

    Making Sure Your Custom Fields and Data Come Along

    The final step is managing your data. What happens to information in fields from the "Bug" that don't exist on the "Story" screen? For example, your bugs might have a required "Affects Version" field that stories do not.

    Jira is smart enough not to let you lose important data by accident. The wizard will make you decide what to do. You'll have to set new values for any required fields on the target "Story" that are currently empty. For fields that don't exist on the new issue type, the data is simply left behind.

    Before finalizing, think carefully. If a custom field on the original issue contains critical notes, ensure a corresponding field exists on the new one. If not, copy that information into the description or a comment before you complete the move.

    After reviewing all your mappings on the final confirmation screen, click Move. Jira handles the rest. The issue key (e.g., DEV-123) will remain the same, but its type will now be "Story," and it will operate within its new workflow.

    Mastering Bulk Changes for Issue Types

    Facing a backlog with dozens or hundreds of misclassified tickets? Changing them one by one is inefficient and tedious. This is where Jira’s bulk change feature becomes essential. It’s a powerful time-saver, but it demands caution—a small mistake can create widespread issues.

    The process hinges on precision. Before you can modify anything, you must isolate the exact issues using a specific Jira Query Language (JQL) search. A poorly constructed query can pull in the wrong tickets, creating a bigger problem than the one you started with.

    This flow breaks down the simple but critical sequence for a bulk change.

    A three-step process diagram for changing Jira issue types, showing select, move, and map.

    These core steps—selecting your issues with JQL, initiating the move, and mapping the fields—are your blueprint for successful bulk changes.

    Crafting Your JQL Search

    Use your JQL query like a surgical tool for precise selection. For example, imagine you need to convert all "Task" issues in the 'Phoenix Project' for the upcoming release into "Bugs."

    A precise JQL query for this scenario would be:

    project = "Phoenix Project" AND issuetype = Task AND fixVersion = "Q3-Release"

    This query ensures you only target Tasks in the specified project and release, dramatically reducing the risk of unintended changes. If you're new to JQL, learning how to create a filter in Jira is an excellent way to practice building accurate queries.

    Once your search results are correct, click the actions menu (the three dots in the top-right corner) and select Bulk change all issues. This will start the same 'Move' wizard used for a single issue, but with higher stakes.

    Navigating the Bulk Move Operation

    While the bulk change process mirrors the single-issue move, there's a crucial difference: every decision applies to all selected issues. This requires extreme care, especially on the status and field mapping screens.

    For instance, the tickets you've selected might be in different statuses, such as "In Progress" or "To Do." The wizard will prompt you to map each of these current statuses to a valid one in the new workflow.

    Pro Tip from the Trenches: Always run a small test batch first. Before you pull the trigger on 200 issues, tweak your JQL to grab just 2 or 3 of them. Run the entire bulk move on that small sample to make sure the field mappings and status changes work exactly as you expect. This five-minute sanity check can save you hours of painful cleanup later.

    Field mapping is also more complex in bulk operations. If any selected issues contain data in fields that do not exist on the new issue type, that data will be lost. The wizard will warn you, but it's your responsibility to verify that no critical information is dropped. Pay close attention to the final confirmation screen before you commit.

    Single vs Bulk Issue Type Change Comparison

    Here’s a quick breakdown of when to use each method and what to watch out for.

    Consideration Single Issue Change (UI Move) Bulk Issue Change (Bulk Operation)
    Best Use Case Correcting a single misclassified issue. Reclassifying multiple issues at once (e.g., post-import cleanup).
    Prerequisites 'Move Issues' project permission. 'Move Issues' & 'Bulk Change' global permissions.
    Initiation From the 'More' (…) menu on the issue view screen. From the search results screen after running a JQL query.
    Risk Factor Low. The impact is limited to one issue. High. A mistake affects every issue in your query.
    Key Challenge Minimal; typically a straightforward process. Ensuring JQL precision and carefully mapping statuses/fields.
    Pro-Tip Quick and easy for one-off fixes. Always perform a small test run on 2-3 issues first.

    Both methods are valuable. Use the single-issue move for daily corrections and the bulk operation for large-scale administrative tasks, always respecting the power it wields.

    Common Pitfalls and How to Protect Your Data

    Changing an issue type in Jira seems simple, but it's filled with potential traps. Teams can accidentally delete crucial data or break automations with a single misstep. Understanding these risks is the best way to safeguard your project data and maintain smooth operations.

    A sketch illustrating system protection with a shield, process windows, broken automation, and data backup.

    The most frequent error is accidental data loss. If your "Bug" issue has a custom field like "Root Cause Analysis" filled with vital information, and you change the issue to a "Story" where that field doesn't exist, the text vanishes from the issue view.

    The data isn't permanently deleted immediately—it's usually orphaned in the database—but restoring it is difficult. Actionable Step: Always review the field mapping screen carefully. If you see a field with important data that has no destination, cancel the move. Copy the data into the description or a comment, then restart the process.

    Renaming vs. Changing an Issue Type

    It's critical to distinguish between changing an issue's type and renaming an issue type globally. These are different actions with vastly different impacts.

    Changing a single issue from a Bug to a Story is a low-risk, routine task.

    However, renaming an issue type at the admin level (e.g., changing "Task" to "Action Item" in settings) can be catastrophic. Data from the Atlassian forums shows this can break up to 62% of custom configurations. JQL queries, filters, and boards referencing the old name will instantly fail. Worse, 75% of related automation scripts could stop working, inflating resolution times by over 55%.

    My golden rule is this: Once an issue type is in active use, treat its name as permanent. If the name is truly causing problems, it’s far safer to create a new issue type with the right name and migrate the issues over. Don't risk a global rename.

    Protecting Your Workflows and Automation

    Workflows are another major vulnerability. When you change an issue's type, it might move to a new workflow. If the issue is in a status like "Ready for QA" that doesn't exist in the destination workflow, Jira will force you to map it to a new status.

    A poor mapping choice—such as moving "Ready for QA" back to "To Do"—can derail your process by skipping a critical quality check. To manage this better, review our guide on changing workflows in Jira.

    Approach every issue type change defensively. Double-check field mappings, understand the difference between moving and renaming, and consider the downstream impact on workflows and automations. A few minutes of diligence can save hours of cleanup.

    Frequently Asked Questions About Jira Issue Types

    Even with clear instructions, you may encounter tricky situations when changing issue types in Jira. Here are answers to the most common questions.

    What Happens to the Original Issue Key When I Change the Issue Type?

    Nothing at all. The issue key, like PROJ-123, is its permanent identifier. It remains with the issue regardless of type changes or even moves to different projects.

    This is crucial for maintaining a complete audit trail and historical context. All existing links in Confluence, bookmarks, or chat messages will continue to work correctly, preventing broken references and confusion.

    Can I Change an Issue Back to Its Original Type?

    Yes, the process is fully reversible. Follow the same "Move" steps as before, but select the original issue type as your destination.

    However, be cautious. Reversing the change requires the same diligence as the initial move. If you added data to custom fields that only exist on the new issue type, that information could be lost when you switch back. You will have to map statuses and fields again, so proceed carefully.

    Just because you can undo something doesn't mean it's risk-free. If you've added critical information, play it safe. Copy it into the description field or a comment before you change the type back. That way, nothing gets lost in translation.

    Why Is the Move Option Greyed Out or Missing?

    This is almost always a permissions issue. The "Move" operation is powerful, and Jira protects it with two specific project-level permissions:

    • Move Issues: This permission is required to launch the move wizard.
    • Edit Issues: This permission is necessary to modify the issue's data, including its type.

    If you are missing either of these permissions for the relevant project, the option will be unavailable. To resolve this, contact your Jira Administrator and request the necessary permissions for that specific project.

    Is It Better to Create a New Issue Instead of Changing the Type?

    This depends on the situation, but the guiding principle is to maintain clarity and a clean audit trail.

    Here are two scenarios to guide your decision:

    1. For simple corrections: If an issue was logged as a "Task" but is clearly a "Story," changing the type is the best approach. It's fast, efficient, and avoids cluttering your backlog.
    2. For a massive change in scope: If a simple bug report evolves into a major project spanning multiple sprints, create a new "Epic" and link it to the original bug. This cleanly separates the initial report from the larger implementation effort.

    When in doubt, choose the action that makes the workflow easiest for everyone to understand. If your team frequently debates issue types, it may be time to establish clearer project guidelines. For more ideas on streamlining processes, explore our guide to Jira workflow automation.


    At Harmonize Pro, we build powerful Jira apps that turn your complex processes into dynamic, automated workflows. With Nesty, you can enforce quality gates, automate handoffs between teams, and build unlimited nested checklists right inside a single Jira ticket, ensuring no step is ever missed. Transform your Jira workflows with Nesty.

  • A Practical Guide to Time in Status Jira for Workflow Mastery

    A Practical Guide to Time in Status Jira for Workflow Mastery

    So, what exactly is Time in Status in Jira?

    Put simply, it's the exact amount of time an issue hangs out in a specific stage of your workflow. Think 'In Progress,' 'Code Review,' or 'Waiting for QA.' It's a stopwatch for each step in your process, telling you precisely how long things actually take. This isn't guesswork; it's concrete data that shows you where work flies and where it gets stuck.

    Why Tracking Time in Status Is a Game-Changer

    A hand-drawn Kanban board illustrating a software development workflow, showing tasks, bottlenecks, and elapsed time.

    We've all been there—sprints feel crunched, and deadlines keep slipping, but it’s hard to put a finger on exactly why. Hidden delays are often the culprit. A task might look like it’s moving along, but the real story is how much time it spends just sitting idle between active work.

    Tracking time in status is the diagnostic tool you need to expose these hidden truths. It transforms that vague feeling of inefficiency into a clear, actionable insight. Is 'Code Review' the black hole where all tickets disappear? Do issues languish for days in 'Waiting for QA'? This one metric holds the answers.

    This kind of visibility is powerful. It equips everyone, from Scrum Masters to Product Managers, to make smarter, system-level decisions. It’s not about watching people—it's about watching the process.

    Uncovering Workflow Bottlenecks

    The number one reason to track this metric is its uncanny ability to shine a spotlight on friction. When you discover that tickets consistently spend 70% of their lifecycle in a single status, you've just found your biggest opportunity for improvement.

    A long time in status can point to a few common culprits:

    • Resource Constraints: Maybe the QA team is overloaded, or only one senior engineer is available to approve pull requests.
    • Clunky Handoffs: It could be that developers aren't providing the right info when they pass a ticket to testing, causing it to stall out.
    • External Dependencies: You might find a task is stuck 'Waiting for Feedback' from a stakeholder who isn't part of the core team.

    In fact, Atlassian’s own research found that teams can lose a staggering 25% of their time just looking for information. Time in status helps you see exactly where those information gaps and process snags are happening, so you can start reclaiming that lost productivity.

    Actionable Insight: Time in status isn't a performance metric for individuals; it's a health check for your process. Use it to find and fix systemic problems, not to point fingers.

    Making Data-Driven Decisions

    With hard numbers on status timing, your conversations change dramatically. Instead of saying, "I feel like code reviews are taking forever," you can state, "The average time in 'Code Review' was 4.2 days last sprint, up from 2.8 days the sprint before." Now you have a real problem to solve.

    This data-backed approach is what drives meaningful change. It’s a core component of any good developer time tracking software because it helps justify process improvements, argue for more resources, or adjust workflow rules with total confidence.

    Here’s a quick breakdown of how this metric directly helps your team.

    Core Benefits of Monitoring Time in Status

    Benefit Impact on Your Team Example Scenario
    Pinpoint Bottlenecks Identifies specific stages where work slows down or stops. Issues consistently spend 5 days in 'Peer Review' before moving to QA.
    Improve Predictability Helps create more accurate sprint forecasts and project timelines. Knowing the average cycle time allows for better estimation of future work.
    Optimize Handoffs Highlights friction between teams or roles, such as Dev to QA. A long 'Ready for Deployment' status may signal a cumbersome release process.
    Validate Process Changes Measures the impact of workflow adjustments over time. After simplifying the review process, 'Time in Review' drops by 40%.

    Ultimately, by understanding where time goes, you can focus your energy on the improvements that will have the biggest impact on your team's flow and output.

    Using Jira's Built-In Reports for Status Tracking

    You don't need a fancy Marketplace app to start finding answers. Jira already has powerful reporting tools baked right in. If you know where to look and how to read them, you can uncover the bottlenecks that are dragging your team down.

    We're going to focus on two of the most valuable reports for analyzing time in status in Jira: the Control Chart and the Cumulative Flow Diagram. Think of them less as static charts and more as diagnostic tools—an X-ray of your team's workflow health.

    Decoding the Control Chart

    To understand the cycle time for individual tickets, start with the Control Chart. It shows exactly how long issues take to get from a starting point (like 'In Progress') to a finish line (like 'Done'). Its real power lies in spotting outliers and measuring the consistency of your workflow.

    When you pull up a Control Chart, look for these key elements:

    • The Blue Line (Rolling Average): A downward trend is your goal; it means your team is getting faster. If it trends up, it's time to investigate what's slowing you down.
    • The Grey Area (Standard Deviation): This is your "normal" range. Most of your issues should fall within this zone.
    • Outliers: Any dots floating high above that grey area demand attention. These tickets took too long and are perfect for a "what happened here?" investigation in your next retro.

    Here’s what a typical Control Chart looks like, showing the cycle time for a batch of completed work.

    See those few dots way above the shaded area? While most issues are clustered near the average, those outliers represent significant delays that are worth digging into.

    Spotting Bottlenecks with the Cumulative Flow Diagram

    While the Control Chart zooms in on individual issues, the Cumulative Flow Diagram (CFD) gives you the bird's-eye view of your entire workflow. It’s a stacked area chart where each colored band represents a different status.

    The secret to reading a CFD is simple: watch the width of the bands.

    Actionable Insight: If a band for a specific status starts getting wider over time, that’s your bottleneck. It means work is piling up in that stage faster than it’s leaving.

    Imagine the 'In Review' band on your CFD starts to bulge. That’s a clear sign that your review process is overwhelmed. Bring this chart to your next team retrospective to kickstart a conversation on how to fix it.

    Filtering Reports to Get Actionable Insights

    Generic reports are interesting, but they often don't tell you what to do. The real magic happens when you use Jira Query Language (JQL) to filter these reports and zero in on specific parts of your process.

    Instead of looking at every issue, create filters for your board to analyze just one team's performance, a single feature, or a certain type of work.

    Here are a few JQL examples to get you started:

    • By Epic: parentEpic = "PROJ-123"
      • Use this to: See if a major feature is getting bogged down in a specific stage.
    • By Team: labels = "team-alpha"
      • Use this to: Compare different squads' workflows to see what's working well.
    • By Issue Type: issuetype = Bug
      • Use this to: Isolate your bug-fixing process and measure how quickly issues are resolved.

    When you combine sharp JQL filters with the Control Chart and CFD, you go from just looking at data to actually diagnosing problems. These native tools provide a solid starting point for anyone serious about improving their workflow.

    To get a broader look at all of Jira's reporting options, you can get a great overview when you learn how to create a report in Jira. This is especially helpful when you need to understand how to effectively track QA metrics using Jira for more specialized reporting needs.

    Building Custom Trackers with JQL and Automation

    While Jira's built-in reports offer a decent bird's-eye view, they often don't have the granularity you need for real process improvement. When the standard charts can't answer your specific questions about time in status in Jira, it’s time to build a custom solution with Jira Automation and JQL.

    This method shifts you from just observing data to actively collecting it. Instead of being limited to Jira's default cycle time calculations, you can create a permanent, searchable audit trail of every single status transition for every ticket.

    The Power of Automated Timestamps

    The strategy is simple and powerful: set up an automation rule that stamps the date and time every time an issue moves into a specific status. By creating custom date/time fields like "Review Start Time" or "QA Entry Time," you build a precise, queryable record of your workflow.

    Suddenly, you're no longer constrained by the pre-set calculations in Jira's reports. You have raw, accurate data that you can slice and dice however you see fit on your dashboards.

    Actionable Insight: Automating timestamps with custom fields puts you in the driver's seat. You can measure the exact time spent in any phase of your workflow, calculate specific SLAs, and build dashboards that spotlight the bottlenecks that truly matter to your team.

    This approach lets you turn a precise JQL filter into a powerful visualization, giving you a clear picture of your team's flow.

    A three-step process flow on Jira reports: JQL Filter, Control Chart, and Cumulative Flow.

    As the diagram shows, a well-crafted JQL query is the foundation. It feeds directly into tools like the Control Chart or Cumulative Flow Diagram, turning raw data into real-world insights.

    Creating Your Status Timestamp Automation

    Let’s walk through a common real-world scenario. Imagine you want to track exactly how long issues linger in the "In Review" status to make sure pull requests aren't going stale.

    First, create two custom fields in your Jira instance:

    • A Date Time field called Review Entry Date.
    • A Number field called Time in Review (Days).

    Once those fields are ready, build a two-part automation rule.

    Part 1: When an issue enters "In Review"

    • Trigger: When an issue is transitioned to "In Review".
    • Action: Edit the issue and set the Review Entry Date field to the current time using the smart value {{now}}.

    Part 2: When an issue leaves "In Review"

    • Trigger: When an issue is transitioned from "In Review".
    • Action: Edit the issue again. This time, set the Time in Review (Days) field using this smart value: {{now.diff(issue.customfield_XXXXX).days}}. You'll need to replace XXXXX with the actual ID of your Review Entry Date custom field.

    This simple setup creates an incredibly valuable feedback loop. The moment a developer resolves a code review, Jira instantly calculates and stores the total time that ticket spent waiting for approval.

    Unleashing Your Data with JQL

    With your automation collecting data, JQL becomes your primary tool for analysis. That custom number field is now a powerful filter you can use to ask very specific questions.

    For example, want to find all tickets that were stuck in review for more than three days last quarter? This JQL query will pull that list instantly:

    project = "Your Project" AND "Time in Review (Days)" > 3 AND resolved >= -90d

    This is the kind of insight that’s impossible to get from standard reports but becomes trivial with a bit of automation. You can save this query as a filter and plug it into a dashboard gadget to create a live "SLA Breach" widget for your team to monitor. To get the most out of this, you’ll want to know how to properly create a filter in Jira to power these custom views.

    This DIY approach also reflects a much bigger trend. With 93% of organizations reporting that automation has boosted their efficiency, using Jira Automation for this kind of tracking is a perfect, practical example. It cuts out the manual grunt work and gives you the exact data you need to fix those critical handoffs between teams.

    When It’s Time to Bring in a Marketplace App for Deeper Insights

    Native Jira reports and custom automation are great places to start, but eventually, you might hit a wall. When you need more sophisticated reporting, proactive process controls, and solutions that work right out of the box, the Atlassian Marketplace is the place to go. These apps are purpose-built to solve the complex challenges of tracking time in status in Jira at scale.

    This is about more than just building prettier charts. It's about shifting your entire mindset from passively measuring delays to actively preventing them from happening in the first place. Marketplace apps give you a level of control and automation that's incredibly difficult to build yourself, especially as your team grows.

    Moving From Measurement to Proactive Intervention

    Sure, a custom automation rule can tell you a ticket was in 'Blocked' status for 48 hours after the fact. A dedicated Marketplace app, however, can step in and take immediate action while it's happening. That’s the real game-changer: moving from historical analysis to real-time process governance.

    Here are some actions you can implement with an app that are tough to do with native tools alone:

    • Automated SLA Alerts: An app can instantly notify a manager and escalate a ticket if it lingers in the 'Blocked' status for more than a set time, say, 24 hours.
    • Enforcing Quality Gates: Some apps can act as a gatekeeper, preventing an issue from leaving 'In Review' until a specific checklist is completed and all its sub-tasks are closed out.
    • Complex Handoffs: An app like Nesty from Harmonize Pro can orchestrate tricky, multi-step handoffs. When a developer moves a ticket to 'Ready for QA', the app can automatically reassign it to the QA lead, ping a specific Slack channel, and even attach the latest build artifacts.

    This kind of proactive control hardens your process. It dramatically reduces the chance of human error and ensures everyone follows the workflow standards you’ve agreed upon, every single time. Your team is freed from the manual coordination that so often grinds things to a halt.

    When an App Delivers Clear ROI

    Investing in a paid tool needs a solid justification. The decision usually boils down to whether the app saves you more time, money, and headaches than it costs. For larger organizations, this isn't just a nice-to-have; it's a critical part of maintaining efficiency.

    With Jira Cloud now supporting up to 100,000 users per site, scalable and automated process controls are essential for good governance. As Jira's scalability for large enterprises has grown, Marketplace apps that manage time in status have become crucial for maintaining workflow integrity in these massive, complex instances.

    The Atlassian Marketplace is filled with powerful options for reporting and process control.

    This vast ecosystem of apps is designed to extend Jira’s core features, helping you tackle specific needs like advanced time tracking and deep workflow automation.

    Actionable Insight: The real value of a Marketplace app is its ability to turn your ideal process—the one you wrote down on a wiki page—into a self-managing, automated workflow that’s actually enforced inside Jira.

    So, how do you choose? Deciding between native tools, building your own automation, or buying an app involves a trade-off. Here’s a quick look at how they stack up.

    Comparing Methods for Tracking Time in Status

    This table breaks down the pros and cons of each approach, helping you decide which path is right for your team's needs and resources.

    Method Setup Effort Reporting Flexibility Best For
    Native Jira Reports Low Low to Medium Quick health checks and identifying obvious, high-level bottlenecks.
    Custom Automation Medium High Teams that need specific, granular data points not available in default reports.
    Marketplace Apps Low to Medium Very High Teams needing advanced reporting, proactive alerts, and enforced process controls out-of-the-box.

    Ultimately, the choice comes down to your pain points. If you find your team is constantly spending time manually pulling data, policing workflows, or chasing people down for updates, a Marketplace app is almost certainly a worthwhile investment. It lets your team get back to doing their actual work instead of just managing the tool.

    Practical Tips and Common Pitfalls to Avoid

    A checklist on a notepad: effective review practices with green checks and poor practices with red crosses.

    Getting your hands on time in status Jira data is a great start, but the real magic happens in how you use it. Just looking at the numbers won't change a thing. You need a game plan to turn those metrics into genuine process improvements and build a culture of continuous improvement, not one of blame.

    Think of these metrics as a health check for your workflow, not a report card for your team members. When you see a long delay, the first question should always be, "What in our system caused this?" not, "Who took so long?"

    Standardize and Define Your Workflow

    Inconsistent workflows are the kryptonite of accurate data. If one team uses "Peer Review" while another uses "Code Review," you can't compare their performance. Getting everyone on the same page is the bedrock of reliable measurement.

    Before you track anything, get your team to agree on a single, shared workflow. Once you’ve done that, define crystal-clear exit criteria for every single status.

    What does it really mean for a task to move from 'In Progress' to 'In Review'?

    • All code is committed to the main branch.
    • Unit tests have been written and are passing.
    • The ticket is linked to the pull request.

    Having an explicit checklist like this kills ambiguity. It makes handoffs clean and complete, preventing the dreaded back-and-forth ticket bouncing that inflates your time-in-status metrics.

    Avoid Using Data as a Weapon

    This is the fastest way to make your metrics worthless. The moment you use time in status to call out a team member or factor it into a performance review, you've poisoned the well. People will immediately start finding ways to game the system to make their numbers look better, and your data will become a work of fiction.

    Actionable Insight: Treat a high time in status as a signal that the process is failing the person, not the other way around. Is a developer waiting on an environment? Is QA blocked by vague requirements? Those are system problems, not people problems.

    Instead of pointing fingers, use the data as a conversation starter. A consistently high time in the 'Blocked' status is your cue to get the team together and figure out how to improve dependency management or communication with other departments.

    Common Misinterpretations and How to Correct Them

    It’s tempting to glance at a chart and jump to a conclusion, but the data only shows you the what. It's up to you and your team to dig in and find the why.

    Here are a few common traps to avoid:

    • Misreading Control Charts: Don't freak out over one data point that's way off the average. A single complex task taking longer is normal. Instead, look for clusters of outliers or a steadily rising trend line—those signal a systemic issue.
    • Setting Unrealistic SLAs: Never pull a Service Level Agreement (SLA) out of thin air, like "all reviews must be done in 24 hours." First, you need a baseline. Measure your average time in review for a few sprints, understand your current reality, and then set a realistic improvement goal.
    • Ignoring 'On Hold' Statuses: If your reports don't pause the clock for statuses like 'On Hold' or 'Waiting for Customer,' your metrics will be skewed. Make sure your reporting tool can tell the difference between active work time and legitimate waiting periods.

    Ultimately, this is all about creating a healthy feedback loop. By setting clear rules for your workflow and using data to improve the system, not punish people, you can unlock significant gains. Exploring advanced Jira workflow automation can be a great way to enforce these standards and take the manual effort out of the equation.

    Answering Your Time in Status Questions

    Once you start digging into Time in Status, you’ll inevitably run into some specific, real-world questions. It's one thing to know the theory, but another to apply it to a messy, living workflow. Let's tackle some of the most common hurdles I see teams face.

    This isn't just about definitions; it's about making sure your data is clean, accurate, and actually helps you improve.

    How Should We Handle 'On Hold' or 'Blocked' Statuses?

    This is a big one. If you don't properly account for statuses where work is legitimately paused, your metrics for active statuses like 'In Progress' will get skewed, making it look like work takes much longer than it actually does.

    The best way to handle this is to configure your reporting tool—whether it's Jira's native Control Chart or a Marketplace app—to exclude specific statuses from its cycle time calculation. For example, you can tell the tool to start the clock when an issue moves to 'In Progress' and stop it when it hits 'Done', but completely ignore any time it spent sitting in 'On Hold'. This gives you a much truer picture of active work time.

    What's the Real Difference Between Cycle Time and Time in Status?

    It's easy to mix these two up, but they tell you very different stories about your workflow.

    Think of it this way:

    • Time in Status is a close-up view. It measures how long an issue sat in one single column, like ‘Code Review’ or ‘QA Testing.’ It’s perfect for pinpointing a bottleneck in one specific step.
    • Cycle Time is the wide-angle shot. It measures the total time an issue takes to travel from a starting point (like ‘In Progress’) to a finish line (like ‘Done’). It’s the full journey.

    The Bottom Line: You use Time in Status to figure out why your Cycle Time is what it is. If your overall Cycle Time is creeping up, a quick look at the Time in Status for each column will show you exactly which stage is the culprit.

    Which Report Should I Show to My Team vs. My Boss?

    Not everyone needs to see the same raw data. You'll get much better results by tailoring the report to who you're talking to. Here’s a simple breakdown I use:

    • For Developers and QA: The Control Chart is gold. It gives them direct, granular feedback on the cycle time of individual stories and bugs. It's the perfect tool for retrospectives when the team wants to discuss why a specific ticket took way longer than everything else.
    • For Scrum Masters and Project Managers: The Cumulative Flow Diagram (CFD) is your best friend. It gives you that bird's-eye view of workflow health and instantly shows where work is piling up. If you need to manage flow and spot systemic bottlenecks, this is your go-to report.
    • For Executives and Stakeholders: Keep it simple. A custom Dashboard Gadget showing high-level metrics is far more effective. For example, a pie chart showing the percentage of tickets that met the "Time in Review" SLA is much more useful to a VP than a complex scatter plot they have to decipher.

    Matching the report to the audience makes sure the data leads to action, not confusion.


    Ready to stop just tracking delays and start preventing them? Harmonize Pro's flagship app, Nesty, transforms your Jira tickets into self-managing workflows. Enforce quality gates, automate complex Dev→QA handoffs, and ensure every step is completed on time, every time—all within a single Jira issue. Discover how Nesty can bring order and predictability to your most complex processes by visiting the Harmonize Pro website.

  • Create a Report in Jira That Drives Real Decisions

    Create a Report in Jira That Drives Real Decisions

    Creating a report in Jira is about transforming project data into clear actions. Start in the Reports section, select a pre-built template like a Sprint or Velocity chart, and then configure it to answer your specific questions. For deeper insights, use Jira Query Language (JQL) to build custom reports from scratch and pinpoint exactly what's driving your project's performance.

    From Data Overload to Actionable Insights

    Jira is more than a task manager; it's your project's data hub, capturing every update, bug, and user story. Without clear reporting, this data is just noise. Mastering Jira reports turns thousands of raw data points into a clear, compelling story about your project's health, allowing you to move from simply tracking work to making informed decisions.

    Effective reporting helps you pinpoint the exact bottlenecks slowing down your sprints. It empowers you to forecast timelines with confidence and gives stakeholders a real-time view of progress without another meeting. Understanding the principles of business intelligence reporting helps you extract the most value from your data.

    Why Jira Reports Are Your Project’s Command Center

    Jira's role as a project command center is undeniable. It currently powers workflows on 42,781 websites globally, and its adoption by 0.71% of the top 10,000 sites highlights its critical function in top-tier organizations. This widespread use means a vast amount of project data is sitting inside Jira, ready to be turned into actionable intelligence.

    A visual showing raw issues transformed into actionable insights, represented by charts and graphs.

    The image above showcases Jira's built-in reports. Each one is a tool designed to answer a specific question about your workflow, helping you make data-backed decisions that move your project forward.

    Expert Tip: For organizations where compliance and process integrity are non-negotiable, these reports are more than just progress trackers—they form a critical part of your project's history. For a deeper dive into this, our guide on https://harmonizepro.com/blog/audit-trail-best-practices is a great resource.

    The key to effective reporting is to start with a clear objective. What specific question are you trying to answer right now?

    Choosing the Right Jira Report for Your Goal

    Use this table to match your immediate objective with the best report for the job.

    Your Goal Recommended Jira Report Key Insight It Provides
    "Are we on track to finish our sprint work?" Sprint Report or Burndown Chart Tracks the remaining work against the time left in the sprint.
    "How much work does our team typically get done?" Velocity Chart Shows the average amount of work a team completes per sprint.
    "How long does it take to resolve bugs?" Resolution Time Report Averages the time it takes to resolve issues.
    "Where are our biggest bottlenecks?" Control Chart Visualizes the cycle time for issues, highlighting outliers.
    "What's the overall workload distribution?" Pie Chart Report (with a "Status" or "Assignee" gadget) Shows how work is distributed across team members or statuses.

    This table is your starting point. As you become more familiar with these reports, you'll learn how to combine their insights for a complete picture of your project's health.

    Interpreting Core Agile Reports Like a Pro

    Generating a report in Jira is the easy part. The real skill is interpreting what the data is telling you. By understanding the two most fundamental Agile reports—the Sprint Burndown and the Velocity Chart—you can elevate your team's conversations from subjective feelings to data-driven action.

    This shifts the discussion from "I feel like we're behind" to "The data shows a potential bottleneck here; let's identify the cause and a solution."

    When the whole team can read these charts, it fosters a powerful sense of shared ownership and a proactive approach to problem-solving. Let's break down how to extract actionable insights from these crucial visuals.

    Decoding the Sprint Burndown Chart

    The Sprint Burndown Chart is your daily pulse check for the current sprint. It compares remaining work against the ideal pace needed to meet your goal. While a perfectly smooth downward line is the textbook ideal, the real story lies in the jagged peaks and valleys. These patterns are not just data; they are signals for action.

    A burndown line that stays flat for the first few days of a sprint is a classic red flag. Actionable Insight: This signals a need to investigate immediately. It could mean the sprint planning was flawed, user stories are unclear, or an early blocker has stopped progress. Address it in the daily stand-up to get work flowing.

    Another common pattern is the "end-of-sprint cliff"—a sharp drop in the final days. Actionable Insight: This often points to rushed work, skipped testing, or tasks being closed without meeting the Definition of Done. Use this pattern as a trigger to review your team's workflow and QA process in the next retrospective.

    Hand-drawn charts illustrating a sprint burndown with flat start and end cliff, and a magnified velocity chart.

    These patterns tell you far more than a simple status update ever could.

    When you can spot these patterns, you can ask much better questions. Instead of a generic "What's the status?" you can lead with, "I see our burndown hasn't moved in two days. What's blocking us from getting those first few tickets rolling?" It completely changes the conversation.

    Leveraging the Velocity Chart for Predictability

    While the burndown chart is a daily snapshot, the Velocity Chart is your long-term strategic guide. It shows your team's output over multiple sprints, measuring the amount of work (in story points) they consistently complete. This historical data is your most reliable tool for realistic planning.

    It prevents overcommitment, reduces team burnout, and manages stakeholder expectations. If your team's average velocity is 30 story points, committing to 50 in the next sprint is a recipe for failure. The Velocity Chart is your data-driven reality check.

    In Jira, you’ll see two bars for each sprint:

    • Commitment (Gray Bar): What the team planned to complete.
    • Completed (Green Bar): What the team actually delivered.

    Actionable Insight: A stable velocity indicates a healthy, predictable team. If you see wild fluctuations between sprints, use this as a prompt to investigate root causes. Are requirements changing mid-sprint? Is the team facing external disruptions? A volatile velocity chart is a clear signal to refine your workflow or improve your team’s focus.

    Stabilizing your velocity often comes down to improving communication and refining your processes. If your chart looks more like a rollercoaster, it might be a good time to revisit your team’s dynamics and explore how to improve team collaboration.

    By using these two core reports together, you build a system that guides your team toward more predictable, sustainable performance.

    Unlocking Custom Insights with JQL

    When standard reports don't answer your most critical questions, it's time to use Jira Query Language (JQL). Think of JQL not as a complex coding language, but as a powerful search tool that lets you build a custom Jira report perfectly tailored to your team's specific needs.

    At its core, JQL combines fields, operators, and values to filter your issues with precision. It’s the engine behind advanced searches, custom dashboard gadgets, and powerful automation rules.

    From Simple Queries to Powerful Filters

    You don't need a technical background to start using JQL. Its logical, sentence-like structure allows you to build queries that answer complex questions with a single line.

    For example, to find all high-priority, open tasks for an upcoming release, you don't need to manually scan a backlog. Instead, a simple JQL query gives you an instant, accurate list:

    project = "Project Phoenix" AND priority = "High" AND status not in (Resolved, Closed)

    This query immediately cuts through the noise. From here, you can easily add more conditions, such as filtering for a specific assignee or issues created within the last two weeks. JQL handles these layers of complexity with ease.

    Here’s what building a query looks like right inside Jira’s search interface.

    This interface shows how you can combine criteria to zero in on the exact list of issues you need for your analysis.

    Actionable JQL Snippets for Common Problems

    The true power of JQL is its ability to create "early warning systems." By saving specific queries as filters and displaying them on a team dashboard, you can proactively identify risks before they derail your project.

    Here are three JQL queries you can implement today to improve your workflow:

    • Find Stale Issues: Pinpoint any ticket that hasn't been updated in a week, indicating it may be stuck or forgotten.
      status not in (Closed, Resolved) AND updated <= -7d

    • Spot Overdue Tasks: Instantly generate a list of all unresolved issues that have passed their due date.
      due <= now() AND resolution = Unresolved

    • Monitor Scope Creep: Identify every issue added to the current sprint after it started, helping you control unplanned work.
      sprint in openSprints() AND issue in sprint = "Sprint Name" AND created > sprint.startDate

    These queries aren't just for pulling lists; they are diagnostic tools. A filter that flags tickets stuck in "In Review" for more than two days isn't just a report—it's a specific talking point for your next stand-up, pointing directly to a bottleneck that needs to be addressed.

    Recent research highlights a critical productivity paradox: while 99% of developers save time with AI, 90% still lose over six hours a week to other inefficiencies. This is where targeted JQL reports make a tangible impact, helping teams find and eliminate the workflow friction that consumes valuable time. Dive into the full developer experience report from Atlassian to learn more.

    By turning these queries into always-on dashboard gadgets, you make crucial insights visible to everyone, fostering a culture of continuous improvement.

    Building a Mission Control Dashboard for Your Team

    Individual reports are useful, but a well-designed dashboard is a game-changer. It acts as your team's mission control—a single source of truth that visualizes project health, tracks progress, and flags risks in real-time. A great dashboard answers the "What's the status?" question for anyone at a glance, eliminating the need for constant check-in meetings.

    The key is to move beyond simply adding gadgets and start curating a collection that tells a cohesive story.

    From Individual Gadgets to a Cohesive Story

    An effective dashboard layers different types of information to build a complete picture. For example, take the "Stale Issues" JQL filter and display it using the Filter Results gadget. Now, place it next to a Pie Chart gadget showing issue distribution by assignee.

    This combination creates a powerful narrative. You not only see which tickets are stale but can also spot if a single team member is overloaded, causing a bottleneck. This is how you transform raw data into actionable insights that lead to better, faster decisions.

    The entire process is powered by a simple, three-step JQL query construction.

    Diagram illustrating the three-step JQL query construction process: identify, filter, and display data.

    It all comes down to identifying the right data, filtering it with precision, and then displaying it visually. This is the core principle behind every useful gadget on your dashboard.

    Essential Gadgets for a High-Impact Dashboard

    Choosing the right gadgets is critical. While Jira offers many options, a few consistently deliver the most value. These are the foundational blocks for a dashboard that provides immediate clarity.

    Gadget Name Primary Use Case Ideal Audience
    Filter Results Display a dynamic list of issues from a saved JQL filter (e.g., stale tickets, high-priority bugs). Everyone
    Pie Chart Visualize issue distribution based on a field like status, assignee, or priority. Team Leads, Managers
    Sprint Health Get a quick, color-coded overview of the current sprint's progress against scope. Scrum Masters, Dev Team
    Sprint Burndown Track the team's progress toward the sprint goal, showing work remaining vs. time. Dev Team, Scrum Masters
    Created vs. Resolved Chart Compare the rate of incoming work against the rate of completed work over time. Product Owners, Managers
    Assigned to Me A personalized "to-do" list showing all issues assigned to the logged-in user. Individual Contributors

    Combine these to answer nearly any question about your team's workload, progress, and potential roadblocks directly from the dashboard.

    Crafting a High-Impact Dashboard Layout

    For a typical software team, a three-column layout is highly effective. It helps you create a report in Jira that balances immediate sprint concerns with a broader view of ongoing work, serving multiple roles at once.

    Use this proven layout as your starting point:

    • Left Column (Sprint Focus):

      • Sprint Health Gadget: Your at-a-glance summary of the current sprint—time elapsed, work done, and any scope creep.
      • Sprint Burndown Gadget: The daily pulse check to keep the team focused on the sprint goal.
    • Center Column (Team Workload & Blockers):

      • Assigned to Me Gadget: A personal to-do list for each team member.
      • Filter Results (Stale Issues): The custom JQL gadget to ensure nothing is forgotten.
      • Filter Results (High Priority Bugs): Keeps the most critical fixes front and center.
    • Right Column (Big Picture View):

      • Pie Chart (Issues by Status): A high-level view of work distribution across your workflow.
      • Created vs. Resolved Chart: Helps you determine if the team is keeping up with incoming work.

    Remember, the best dashboards are living documents. Don't be afraid to experiment. Swap gadgets, tweak the layout, and—most importantly—ask your team what they find useful. Adjust it based on what provides the most clarity and drives the most action.

    A final pro tip on permissions: configure your dashboard so the core team sees all the granular details, while a separate, simplified version is shared with leadership showing only high-level progress charts. This tailored approach ensures everyone gets the right information without being overwhelmed.

    Advanced Reporting Tactics and Best Practices

    You've mastered the built-in reports and built a solid dashboard. But what happens when you need to answer questions that span beyond a single project or require combining Jira data with other business metrics? To unlock the deepest insights, you need to take your data outside of Jira.

    Exporting issue data to a tool like Google Sheets or Microsoft Power BI unlocks a new level of analysis. You can merge Jira metrics with other business data to give stakeholders a panoramic view. Imagine correlating development velocity with customer support ticket volume—you could instantly see how a new feature release impacts bug reports and support requests.

    Extending Jira With Marketplace Apps

    For more powerful reporting directly inside Jira, turn to the Atlassian Marketplace. It's filled with apps designed to solve specific reporting challenges that Jira's native tools don't address.

    A common challenge is tracking the true progress of an Epic with dozens of sub-tasks. Doing this manually is a nightmare. A specialized Marketplace app can automatically roll up the progress of all child issues, giving you an accurate, real-time view of the parent task's status without any manual effort.

    The most effective teams treat Jira not as a closed system, but as a central data hub. They extend its capabilities with apps and connect it to other tools to answer complex business questions that drive strategic decisions.

    This ecosystem is growing rapidly. Atlassian recently hit 120% cloud net revenue retention, a figure driven largely by enterprise adoption and the expanding Marketplace. This signals that Jira Cloud is scaling to meet even the most demanding reporting needs.

    Troubleshooting Common Reporting Headaches

    Even experienced Jira users encounter reporting issues. A report your team can't trust is worse than no report at all. Knowing how to quickly diagnose common problems is a critical skill.

    Here's how to troubleshoot two of the most frequent issues:

    • "My Burndown Chart Isn't Burning Down!" A flat or upward-trending line is almost always caused by scope creep (adding new issues to an active sprint) or re-estimating story points on in-progress tickets. Use this pattern to start a conversation about protecting sprint scope.
    • "My JQL Query is Pulling in Weird Results." This often comes down to a simple operator mistake. A common error is using = for a text field search when the ~ (CONTAINS) operator would provide the more flexible results you need. Always double-check your operators and field names to ensure accuracy.

    Essential Best Practices for Clean Reporting

    Ultimately, accurate reporting depends on clean data. If your Jira instance is disorganized, your reports will be unreliable. A few disciplined habits can prevent major headaches down the line.

    Start by enforcing a strict and descriptive naming convention for all saved filters and dashboards. Instead of a vague name like "Dev Team Filter," use something specific like "P2+ Bugs – Mobile App – Unresolved." This instantly clarifies its purpose and prevents the clutter of duplicate, confusing filters that pollute your instance.

    For a deeper dive into these foundational habits, check out our complete guide on best practices in Jira.

    Answering Common Jira Reporting Questions

    Even with the best tools, you'll encounter specific challenges when creating reports in Jira. Overcoming these common hurdles is key to transforming your data into a reliable source of insight. Let's tackle some of the most frequent questions teams face.

    One of the most common issues is permissions. A team member creates a perfect JQL filter and adds it to a shared dashboard, but their colleagues can't see the results. The Fix: The JQL filter itself must be shared with the same project, group, or users who have access to the dashboard. Check the sharing settings on the filter to resolve this.

    How Can I Report on Story Points for Sub-Tasks?

    This is a major pain point for many teams. By default, Jira’s Agile reports roll up estimates at the parent issue level (like a Story or Bug) and ignore any story points assigned to sub-tasks.

    This makes it difficult to get accurate velocity or burndown charts if your team breaks down work into estimated sub-tasks. Here are two practical solutions:

    • Marketplace Apps: Many reporting apps are built specifically to solve this. They can aggregate story points from sub-tasks up to the parent issue, giving you charts that reflect how your team actually works.
    • Automation Rules: Create an automation rule that copies the story point value from a sub-task to a custom field on its parent. Then, configure your reports to use that custom field for estimation.

    Can I Schedule a Report to Be Emailed Automatically?

    Teams often need to send key reports on a regular schedule, like a weekly summary of resolved issues for leadership or a daily bug report for QA.

    Jira Cloud’s native features for this are limited. You can subscribe to a filter to receive email updates on a list of issues, but you can't automatically email a visual report like a Pie Chart or Burndown Chart.

    For this functionality, you'll need to turn to the Atlassian Marketplace. You'll find numerous apps that offer robust subscription features, allowing you to schedule and email rich, visual dashboard reports as PDFs or images to any stakeholder—even those without a Jira account.

    Mastering these reporting nuances is a core part of effective project management in Jira, providing the clarity your team needs to deliver consistently.


    Stop letting manual steps and missed handoffs slow down your team. Harmonize Pro's Nesty app for Jira turns your complex processes into automated, self-managing workflows directly within your tickets. Enforce your Definition of Done, automate QA handoffs, and ensure every step is completed in the right order, every time. Discover how Nesty can bring order and automation to your most critical workflows.