To create a filter in Jira, navigate to the 'Issues' screen, use the search dropdowns to define your criteria, and click 'Save as' to name your filter. This simple action transforms a chaotic backlog into a focused, actionable list—making it a powerful way to boost your team's efficiency.
Why Mastering Jira Filters Unlocks Team Productivity
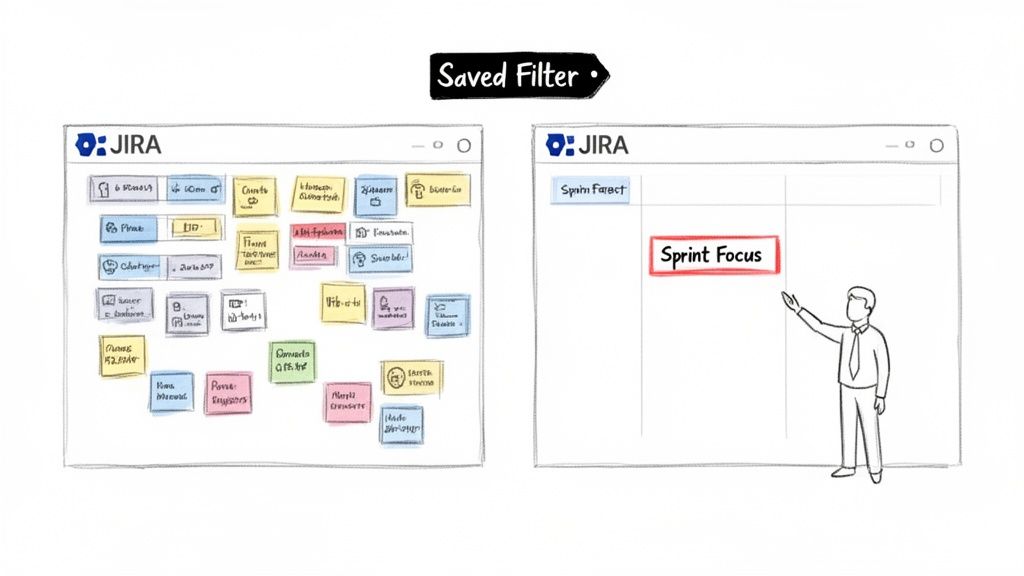
We've all faced a massive, unfiltered Jira backlog. It's a digital wall where critical tasks get buried, causing project anxiety. Learning to create a filter in Jira isn’t just a technical skill; it's the first step to bringing order and clarity to your projects.
For example, a project manager preparing for sprint planning can apply a single filter to instantly see all unassigned, high-priority stories. Filters turn noise into a clear signal, providing immediate focus for your team.
The Foundation of Jira Workflows
Saved filters are the building blocks for nearly every advanced feature in Jira. For any technical role—from developer to DevOps engineer—mastering filters is non-negotiable.
They are the engine behind key Jira functionalities:
Dashboards and Gadgets: Filters power the charts and lists on your dashboards, providing at-a-glance status updates.
Agile Boards: A Jira filter is the core of every Scrum or Kanban board, defining exactly which issues are displayed.
Automation and Subscriptions: Filters define the trigger conditions for automation rules and scheduled email reports, keeping teams updated without manual intervention.
Beyond boosting team output, it's worth exploring broader strategies to improve team productivity to build even more efficient workflows. By making information accessible and relevant, filters directly contribute to better team dynamics and results.
Building Your First Jira Filter: From Basic to JQL
You have two methods to build a filter in Jira: the simple point-and-click Basic search and the more powerful Advanced search using Jira Query Language (JQL). Start with the Basic view. Its dropdown menus let you achieve quick wins immediately.
Navigate to the main issue search screen and you'll find fields for Project, Issue Type, Status, and Assignee. Use these to answer simple, everyday questions without writing any code.
For instance, a product manager can select their project, choose the 'Bug' issue type, and set the status to 'New'. Instantly, they have a list of all newly reported bugs. This immediate feedback is what makes Jira effective for daily task management.
Moving from Clicks to Code with JQL
Once you're comfortable with Basic search, level up by clicking the "Switch to JQL" link. Jira automatically translates your dropdown selections into a JQL query, offering a practical way to learn the syntax.
This is where you unlock Jira's true power and solve complex, role-specific problems.
For anyone on a software development, QA, or DevOps team, learning JQL is essential. Well-crafted filters let you slice through massive backlogs and zero in on exactly what you need, whether it's by assignee, status, priority, or any custom field.
The ability to create and share filters has been a core part of Jira since the beginning. Today, Jira is used on 42,781 websites worldwide. It’s especially critical for larger organizations; a solid 1.1% of the top 10,000 websites depend on Jira to keep their operations running smoothly. If you're curious, you can explore the full Jira statistics and see the data for yourself.
Actionable JQL Queries for Development Teams
Here is a quick reference table with copy-and-paste-ready JQL queries that software, QA, and DevOps teams can use immediately.
Team Role
Goal
Example JQL Query
DevOps Engineer
Find all 'In Progress' deployment tickets for a specific release.
project = "PROJ" AND issuetype = "Task" AND status = "In Progress" AND fixVersion = "Release 2.5"
QA Engineer
Isolate unassigned critical bugs reported in the last 7 days.
project = "PROJ" AND issuetype = "Bug" AND priority = "Critical" AND assignee IS EMPTY AND created >= -7d
Developer
View all open stories assigned to you in the current sprint.
project = "PROJ" AND assignee = currentUser() AND status not in (Closed, Resolved) AND sprint in openSprints()
These queries are excellent starting points. Tweak them to match your team's specific projects, issue types, and workflows.
Once your query returns the desired issues, click the "Save as" button at the top of the search results. Give your filter a descriptive name, like "QA – Unassigned Critical Bugs – Last 7 Days," so you and your team can easily find it later. With one click, your custom query is saved and ready for reuse.
Sharing Filters and Managing Permissions Effectively
You've built the perfect filter. Its real power is unlocked when you share it, turning a personal query into a shared source of truth for your team. However, incorrect permissions can create a messy, confusing Jira instance.
The moment you hit "Save," Jira will prompt you to set permissions. Don't rush this step. If the filter is for your personal to-do list, keep it Private. If it defines your team’s sprint backlog, share it so everyone is aligned.
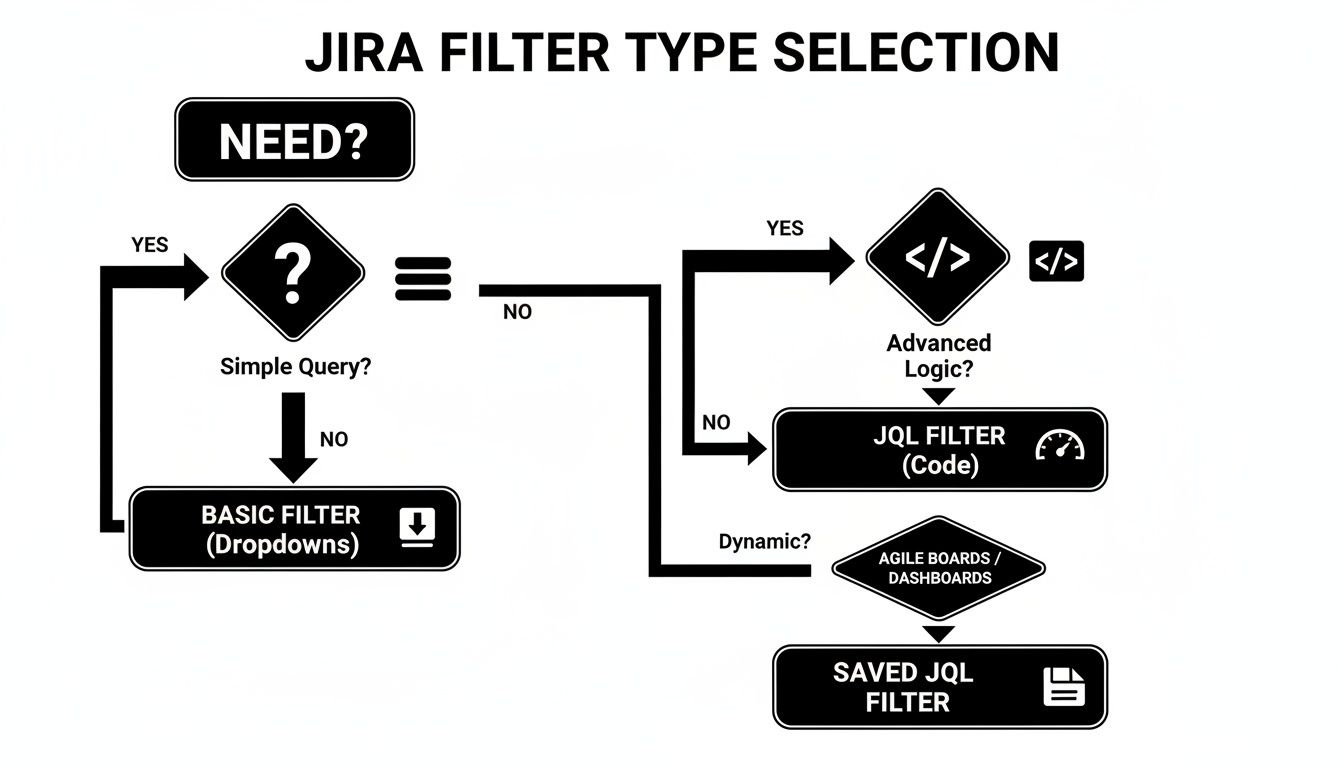
Deciding between a basic search and JQL often comes down to complexity. This flowchart breaks it down.
As you can see, basic dropdowns are great for straightforward searches. For anything with multiple conditions or nuanced logic, jump straight into JQL.
Choosing the Right Sharing Level
Jira provides several sharing options. Think carefully about who needs access before granting it.
Group: The best choice for sharing with a specific team, such as 'UX-Designers' or 'Backend-Devs'.
Project: Ideal for filters that everyone on a project needs, like a 'Release 4.2 Bug Triage' filter.
Public: Use this with extreme caution. Public makes the filter visible to everyone on your Jira site, which can create significant clutter.
Pro Tip: Set Up Filter Subscriptions Subscribe to a filter to receive its results in your inbox on a set schedule. For example, a support lead can get a daily 8 AM email listing all new high-priority tickets, ensuring nothing is missed at the start of the day.
Bringing Your Filters to Life on Dashboards and Boards
Saved filters are the engines that power Jira’s visual tools. Once saved, a filter can be plugged into dashboards and Agile boards to transform raw data into an at-a-glance overview for your team.
Think of your dashboard as a real-time command center. By connecting a filter to a gadget, you can turn a long list of issues into a visual story that is instantly understandable.
Powering Dashboard Gadgets
A product manager can build an entire release dashboard using a few key filters paired with different gadgets.
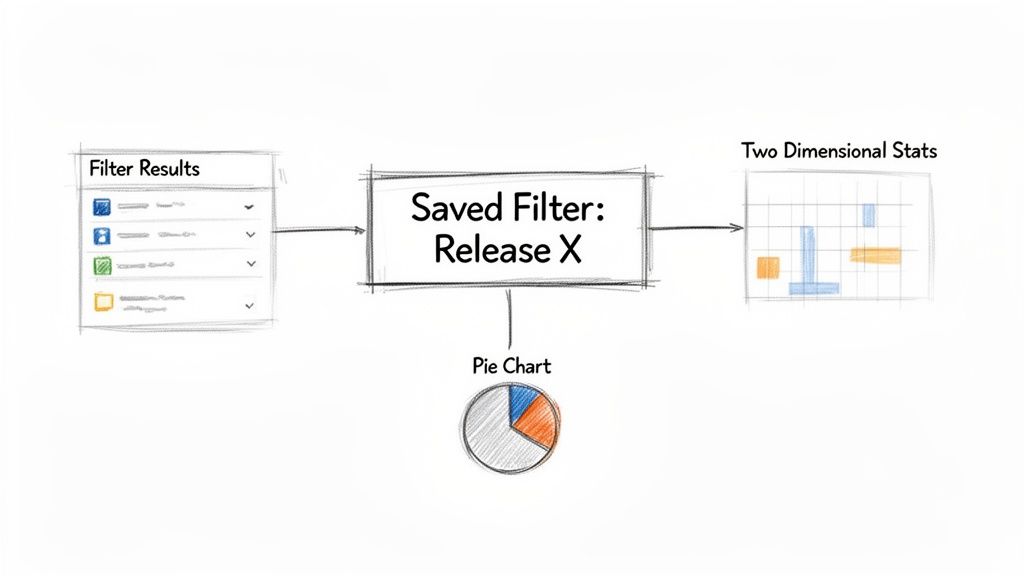
Filter Results Gadget: Use a filter like "New Feature Requests – Release 3.0" to display a clean, sortable list of incoming ideas.
Pie Chart Gadget: Apply a filter for "Release 3.0 – All Issues" and set the gadget to visualize issue statuses. This provides an instant breakdown of work that is in progress, in review, or done.
Two Dimensional Filter Statistics: Use a broad filter like "All Team Tasks" and configure the gadget to plot Assignee against Priority. This helps identify who has the most high-priority work.
This ability to visualize data addresses a long-standing need in the Jira community for better ways to get specific counts, like how many issues are assigned to each person. Now, with filters driving these gadgets, teams can get the exact stats they need to manage projects where 68% of issues might be flagged as Major priority. For more on this, the Atlassian community has some great discussions.
Defining Agile Boards
For any team using Scrum or Kanban, a single filter serves as the source of truth for their Agile board. The JQL query behind that filter dictates exactly which issues appear. This gives you complete control over your team’s focus.
The filter behind a board is its constitution. Modifying that filter directly changes what the team sees and works on every single day. This is how you create specialized, high-visibility views for different project needs.
For instance, if your board is cluttered with old tickets, tweak its filter to exclude resolved issues older than 30 days. To create a hyper-focused view, change the board’s filter to pull in only the issues from a single epic, isolating all related stories and sub-tasks.
Pairing targeted filtering with smart workflows allows you to automate how issues move across the board. For a deep dive into that, check out our guide on Jira workflow automation.
Advanced JQL Functions and Filter Best Practices
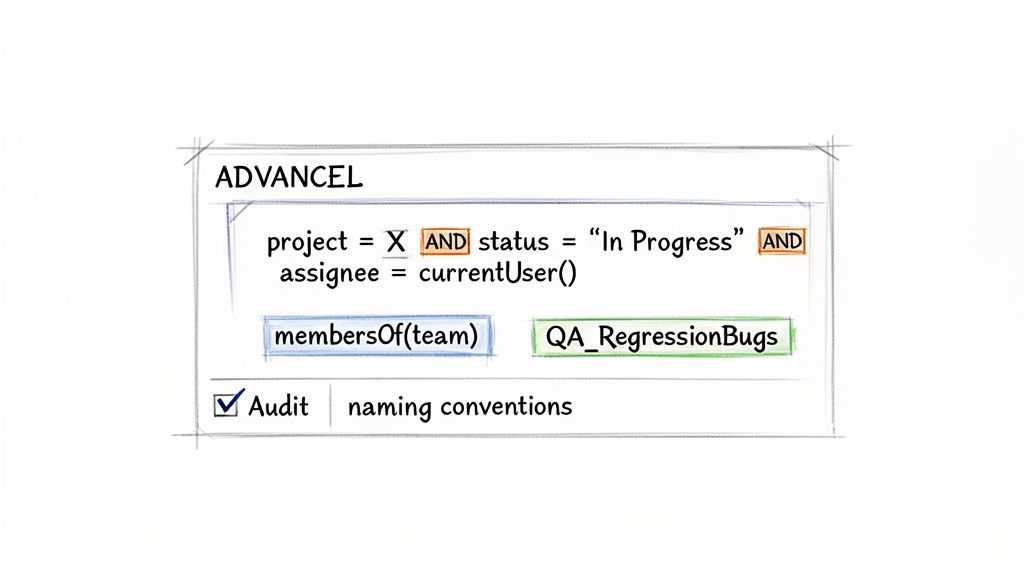
To elevate your Jira skills, move beyond static queries and use dynamic JQL functions. These let you build smart filters that adapt to the user, eliminating the need for manual updates. This is the key when you need to create a filter in Jira that works for your entire team with a single query.
For example, assignee = currentUser() creates one "My Open Issues" filter that shows each user their own assigned issues. Similarly, reporter in membersOf("QA-Team") pulls all issues reported by anyone in that group and stays current as team membership changes.
Establish Smart Naming Conventions
As your Jira instance grows, the list of saved filters can become disorganized. A strategic naming convention is crucial for keeping filters discoverable and easy to understand.
A simple, effective format is TEAM_Purpose.
QA_RegressionBugs: Identifies a filter for the QA team tracking regression bugs.
DEV_SprintSpillovers: A developer-focused filter for monitoring work carried over from the last sprint.
SUPPORT_Tier1-Escalations: Clearly shows the support team which tickets have been escalated to them.
This structure makes filters scannable and immediately understandable.
A clean Jira instance is a productive one. Regularly audit your filters to reduce clutter so your team can find information without sifting through obsolete queries. Set a calendar reminder to review and delete unused filters quarterly.
Maintaining Filter Hygiene and Automation
A long-standing challenge for Jira admins is the lack of a built-in method to track filter usage. Since at least 2023, teams have sought ways to identify unused filters, boards, and dashboards. This has led to creative solutions, like using Jira Automation with smart values like {{issues.size}} to log issue counts and approximate usage. The community is always finding new ways to tackle Jira statistics challenges.
Connect your filters to Jira Automation rules to trigger entire workflows. For example, a filter for "Bugs with 'Ready for QA' status" can automatically transition the issue and notify the QA team on Slack as soon as a ticket matches the criteria, creating seamless handoffs.
Got Questions About Jira Filters? Here Are Some Answers
Here are answers to some of the most common questions about working with Jira filters.
How Do I Find a Filter Someone Shared with Me?
To find a shared filter, go to the Filters menu in the main navigation and select "View all filters." Use the search bar to find the filter by name or creator. For frequently used filters, click the star icon to add it to your favorites, which appear directly in the Filters dropdown for quick access.
Can I Edit a Jira Filter Created by Someone Else?
You can only edit a filter if the owner has explicitly granted you edit permissions. In most cases, you won't have them.
The best workaround is to open the filter, switch to the JQL view, and copy the entire query. Then, create a new filter of your own and paste the query. This gives you a personal, editable version to modify.
A quick tip on JQL errors: 90% of the time, they are simple syntax mistakes. Check for a single equals sign (=) instead of an operator like IN or ~ (CONTAINS), or missing quotes around names with spaces. Jira's query validator will highlight the exact problem for you.
How Can I See All Issues Assigned to My Team?
The most effective method is using the membersOf() JQL function. First, ensure your team is set up as a user group in Jira (e.g., "dev-team").
Once the group exists, create a filter with the query: assignee in membersOf("dev-team"). This filter is dynamic; it automatically updates as users are added to or removed from the group, requiring no manual changes.
At Harmonize Pro, we build Jira apps that turn complex processes into automated, transparent workflows. Our app, Nesty, helps teams enforce quality gates and automate handoffs with dynamic nested checklists and smart triggers, all within a single Jira ticket. Streamline your Dev→QA handoffs, deployments, and customer onboarding by visiting us at https://harmonizepro.com/nesty.
To effectively manage test cases in Jira, your first actionable step is to move away from native sub-tasks and install a dedicated test management app from the Atlassian Marketplace. This one change provides structured test repositories, clear traceability from requirement to defect, and reporting dashboards that standard Jira can’t offer. It’s how you transform Jira from a task tracker into a QA command center.
Why Your Native Jira Testing Is Holding You Back
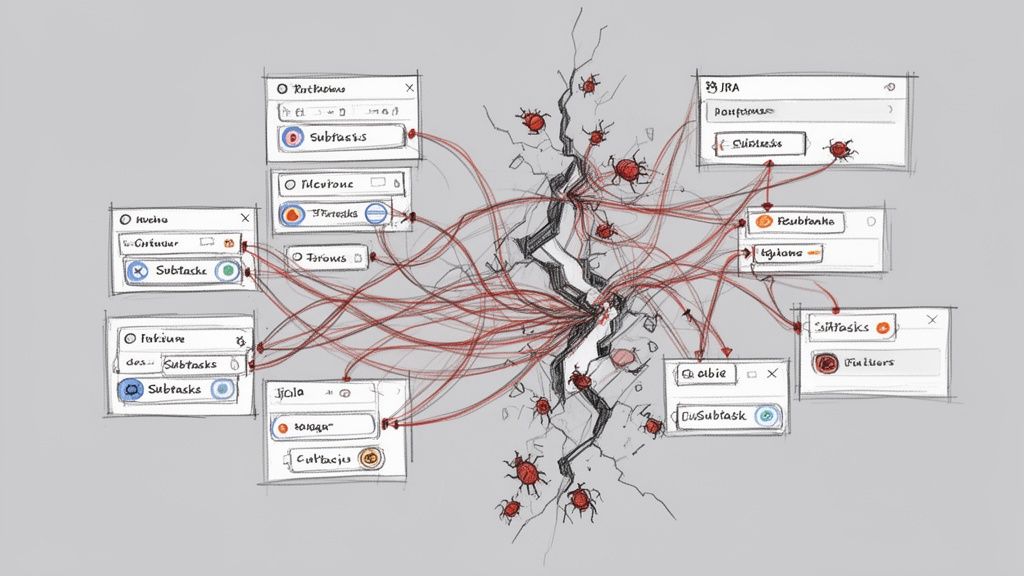
If you're currently using Jira sub-tasks or custom labels for test cases, you've felt the pain. It starts with a few tests tacked onto a user story. Soon, you're lost in a tangled web of tickets where tracking progress is manual detective work, and proving a feature is fully tested is a shot in the dark.
This ad-hoc approach simply doesn't scale.
This disorganization has real consequences. Critical bugs slip through because you lack a clear view of test coverage. Release delays become the norm as teams scramble to manually verify what’s been tested.
We've seen teams repurpose user stories for tests and end up with 30-40% more manual rework, slowing down their release cycles by up to two weeks per sprint. This is a direct hit to productivity.
The Limits of Standard Jira
At its core, Jira is a phenomenal issue and project tracker. But it wasn't built for dedicated test management. Forcing it into that role creates immediate, practical roadblocks.
No Reusability: Test cases created as sub-tasks are trapped. You can't pull them into a regression suite or reuse them in another project without tedious copy-pasting, which introduces errors.
Poor Visibility: Without a central test repository, there’s no single source of truth. To get an overview of all test suites or the overall health of product quality, you have to manually compile data.
Broken Traceability: Can you quickly prove that every requirement in a release is covered by a test case? With native Jira, this means exporting data to a spreadsheet and manually connecting the dots—a process that fails audits and wastes time.
This setup forces QA teams into administrative busywork, pulling them away from their primary mission: ensuring a high-quality product. You can start improving your process by reviewing common workflow pitfalls described in https://harmonizepro.com/blog/changing-workflow-in-jira.
The real cost of native Jira testing isn't just wasted time; it's the erosion of confidence. When you can't trust your process, you can't be certain about your product's quality, which leads to release anxiety and customer-facing defects.
Native Jira vs. Dedicated Test Management Apps
To understand the gap, let's compare the capabilities side-by-side. The difference between using sub-tasks and a purpose-built tool is stark.
Capability
Native Jira (Using Sub-tasks/Labels)
Dedicated Apps (e.g., Nesty, Xray)
Actionable Insight
Test Case Reusability
None. Each test is a one-off sub-task.
Central repository allows reuse across cycles and projects.
Action: Build a regression suite once and reuse it indefinitely, saving hours each sprint.
Traceability
Manual and fragile. Relies on linking issues.
Built-in, end-to-end traceability from requirements to defects.
Action: Generate a traceability matrix report in one click to satisfy audit requirements.
Reporting & Metrics
Basic issue reports. No QA-specific dashboards.
Advanced dashboards for test coverage, pass/fail rates, and more.
Action: Create a live dashboard to show stakeholders real-time quality metrics.
Execution History
Buried in issue comments or requires custom fields.
Detailed, versioned history of every test run.
Action: Pinpoint when a test started failing by comparing execution histories.
The difference is clear. Dedicated apps introduce a structured, professional workflow that native Jira was never designed to support.
A Path Forward with Dedicated Tools
The solution isn't to ditch Jira—it's to augment it. Dedicated test management apps integrate directly into your Jira instance, adding the necessary structure and features. These tools introduce specialized issue types for test cases, test plans, and test executions, giving everything a proper place.
When you layer in smart automation, like the kind Nesty provides, you can build truly intelligent workflows that connect all the pieces. This sets the stage for the practical, step-by-step guidance that follows.
How to Structure Test Cases for Clarity and Reuse
To move past ad-hoc testing, you need a blueprint. Building a solid foundation for managing tests in Jira means creating a structure that brings clarity, encourages reuse, and scales with your team. Your first step is to create a centralized test repository right inside Jira by using a dedicated "Test Case" issue type from a test management app.
This simple move immediately separates your testing artifacts from the development backlog, making them searchable, reportable, and, most importantly, reusable. It's a small change with a massive impact on organization.
Designing the Perfect Test Case Issue Type
A great test case ticket leaves no room for interpretation. It provides all the necessary information so any team member can execute it correctly. Before you build this in Jira, review how to write test cases effectively to master the fundamentals of clarity and reuse.
To standardize everything, configure your "Test Case" issue type to include these key fields:
Summary: A short, clear title (e.g., "Verify user login with valid credentials").
Component: The part of the application under test (e.g., Authentication, Checkout, User Profile).
Preconditions: What must be true before the test starts? (e.g., "User account testuser@email.com must exist and be active.")
Test Steps: A numbered list of specific actions.
Expected Results: For each step, the exact, observable outcome that proves it passed.
This structure removes guesswork and drives consistency across your entire QA practice.
Think of a test case as a recipe. A vague recipe gives you inconsistent results. A precise one ensures anyone in the kitchen can create the same dish perfectly, every time. Your Jira test cases need to be that clear.
The Power of Atomic Test Steps
Vague test steps are the number one cause of flaky test results. Instead of "Test the login form," break it down into atomic actions. This makes the test easier to follow and simplifies debugging.
A Poor Example:
Step 1: Go to the login page and try to log in.
A Much Better Example:
Action: Navigate to the application's login URL. Expected Result: The login page loads with fields for username and password.
Action: Enter a valid, registered username into the username field. Expected Result: The text is accepted by the field.
Action: Enter the corresponding valid password into the password field. Expected Result: The text is masked and accepted.
Action: Click the "Login" button. Expected Result: The user is redirected to their account dashboard.
If this test fails on step 4, the developer knows exactly where the process broke, speeding up the fix.
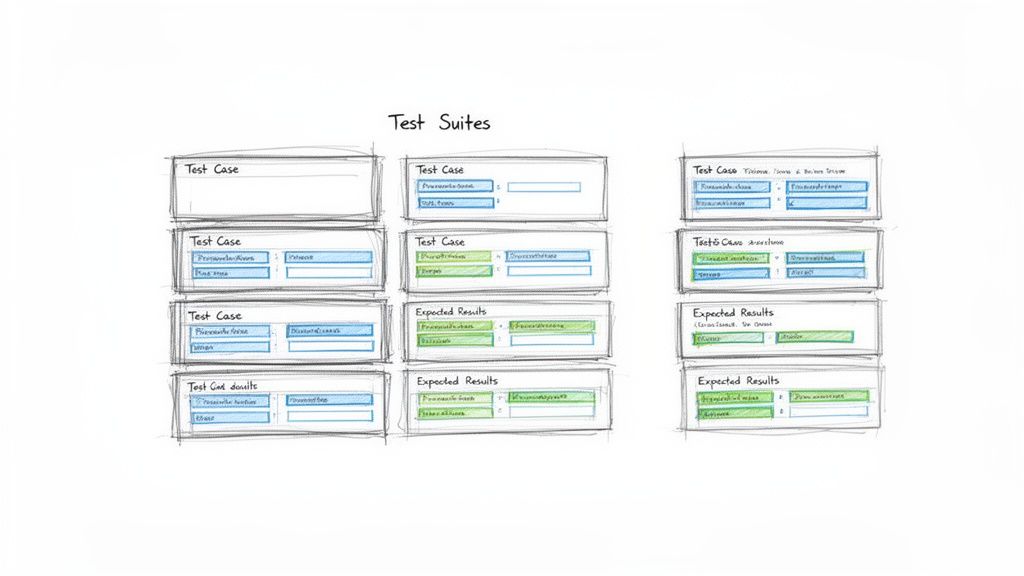
Organizing Tests into Logical Suites
Once you have a library of test cases, you need to group them. This is where test suites (or test sets) come in. These are collections of test cases executed together for a specific purpose. Getting this organization right is crucial for managing test cases in Jira effectively.
Actionable Tip: Use folders or labels within your test management app to create suites like:
By Feature: All tests for the new "Shopping Cart" feature.
By Type: A "Full Regression Suite" containing all critical-path tests.
By Release: A specific set of tests needed to validate the upcoming "v2.1" release.
This doesn't just keep your repository tidy; it makes planning test cycles efficient. A QA lead can simply assign an entire suite to a tester for a given sprint, instead of picking dozens of tests one by one.
This integrated approach pays off. A Forrester study on QA tools found that teams using Jira-native apps achieve 28% higher test coverage rates. They link 92% of requirements to executable tests, a huge leap from the 65% managed in standalone systems. For product managers tracking releases across dev, staging, and production, that’s a game-changer. With a well-structured repository, you're building a foundation for quality that helps you ship more reliable software, faster.
Executing and Tracking Test Cycles with Precision
You’ve built a solid repository of test cases. Now, it’s time to execute and track your test cycles with precision. This is where your Jira setup evolves from a library into a command center for your entire quality assurance operation.
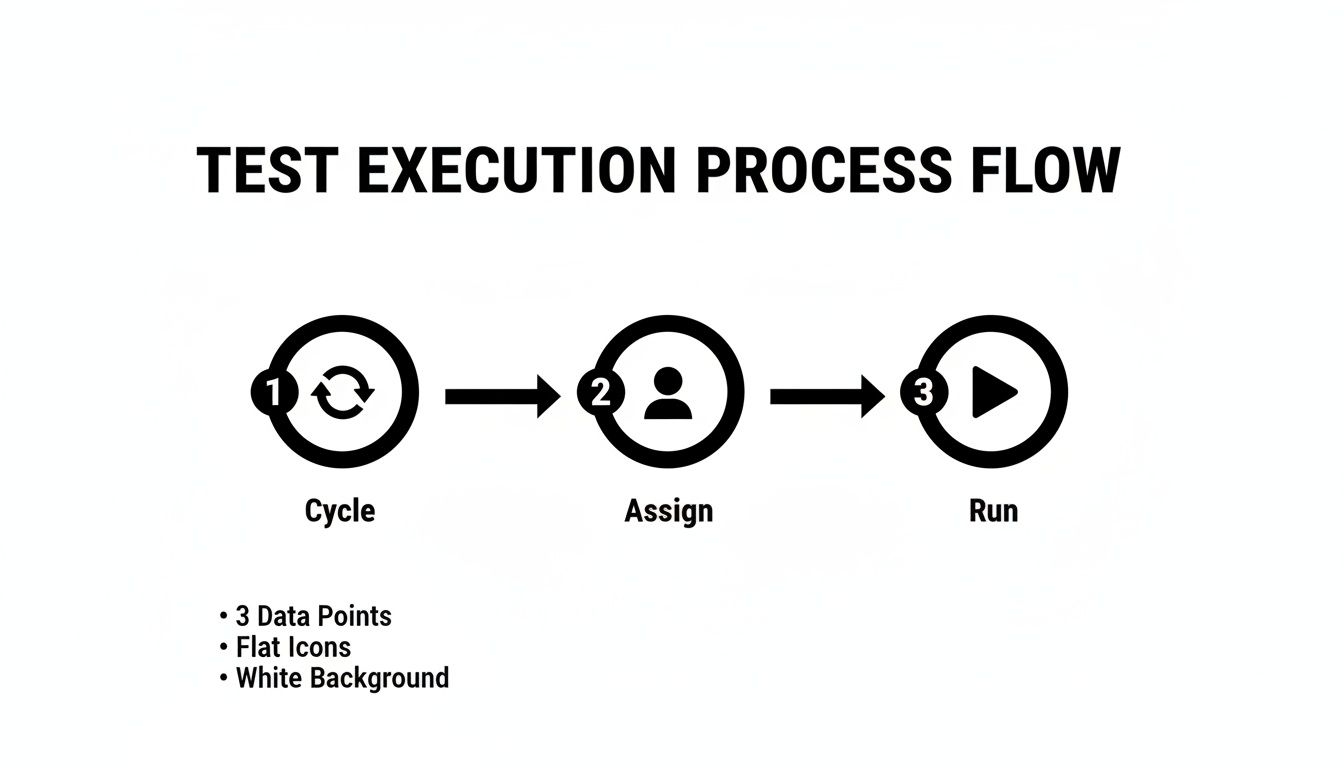
The goal is a clear, repeatable process for running tests against a specific sprint, release, or feature. To do this, group the right test cases into a Test Cycle or Test Run, assign them to QA engineers, and watch the progress unfold in real time. A well-managed cycle in Jira is the antidote to the last-minute chaos many teams dread before a release.
Kicking Off a Test Cycle
A Test Cycle is a specific, targeted mission. For instance, create a cycle named "v2.5 Sprint 3 Regression" or "New User Onboarding Feature." This naming provides immediate context.
Once you have your cycle, pull in the relevant test suites and individual test cases from your repository. Then, assign the whole batch or individual tests to your QA team. This simple act of assigning ownership is critical—everyone knows exactly what they’re responsible for.
Of course, a perfect test case is useless if the environment isn't ready. A test will fail against a broken or outdated build every time. It's crucial to have clear protocols for ensuring the testing environment is stable. For a deeper dive, review these test environment management best practices.
Think of a test cycle like a mission briefing. It defines the objective (what we're testing), assigns roles (who's testing it), and ensures everyone has the right equipment (the correct environment and test data). Without this briefing, teams are just running disconnected drills.
Tracking Execution Status in Real Time
As your testers work, their progress needs to be visible to the entire team—not locked in a spreadsheet. This is where standardized execution statuses are so important. Move beyond vague comments like "it worked" and start marking every test run with a clear, universally understood status.
This immediate feedback loop is a major benefit of managing test cases in Jira. A project manager can glance at a dashboard and instantly understand test cycle progress, see the pass/fail rate, and pinpoint blocked areas.
Essential Test Execution Statuses and Their Meanings
To make real-time tracking work, everyone must use the same statuses. This table breaks down the most common statuses, their meaning, and the next steps for QA and development.
Status
Definition
Action for QA
Action for Developer
Pass
The actual result matched the expected result perfectly.
Move to the next test case. No further action needed.
None. The functionality works as intended.
Fail
The actual result did not match the expected result.
Create a new bug ticket, linking it to this test run.
Investigate the linked bug ticket to identify and fix the issue.
Blocked
The test cannot be executed due to an external factor.
Document the blocker (e.g., "Staging environment is down").
If the blocker is a bug, prioritize a fix. If environmental, coordinate with DevOps.
In Progress
The tester has started executing the test but has not finished.
Continue executing the remaining steps.
Monitor for status changes.
Using these statuses consistently ensures there's no ambiguity. A "Fail" is a clear signal to a developer, while a "Blocked" status tells the team that an external issue needs attention.
Creating an Unbreakable Traceability Chain
The most powerful outcome of this process is an unbreakable chain of evidence. Every action is linked, giving you complete traceability from the initial requirement down to the final test result.
When a test fails, you don't just mark it red. Action: Create a new bug issue directly from the test execution screen. Most dedicated Jira test management apps automate this, pre-populating the bug report with crucial context like the test steps, expected results, and actual results. The tester just needs to add proof—screenshots, videos, or logs.
This new bug is automatically linked to the failed test run, which is linked to the test case, which is linked back to the original user story. This closed-loop system creates a complete audit trail and makes it easy to answer critical questions:
Which requirements are affected by this bug?
What tests were run against this user story?
Has the fix for this bug been verified by QA?
This integrated tracking elevates your team from simply managing tasks to running a sophisticated quality engineering workflow.
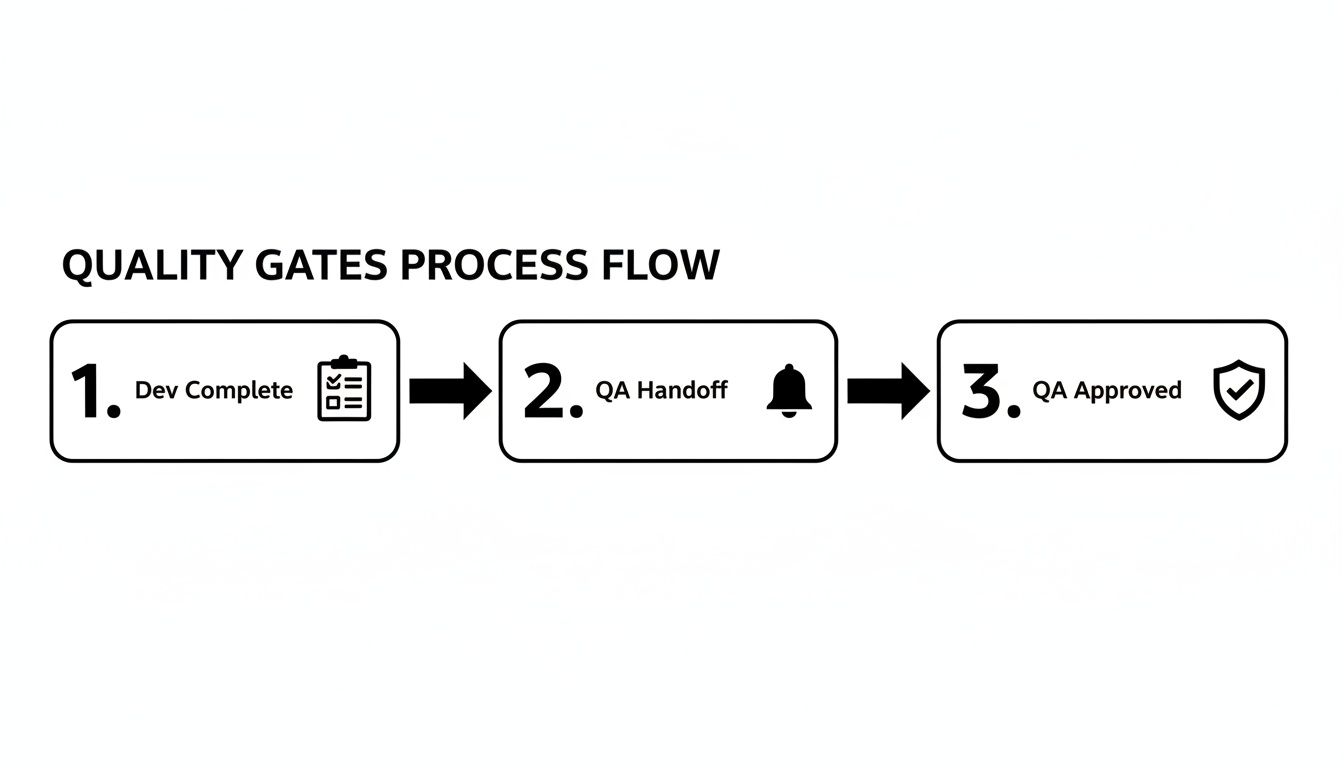
Automating QA Handoffs and Quality Gates
You've got your test cycles running. But the real bottleneck is often the manual handoff. A developer moves a ticket to "Ready for Test," but the QA engineer misses the notification. The ticket sits idle for hours or even days.
This is where you move from managing tasks to orchestrating a workflow. By automating handoffs and building quality gates, you can cut out the manual back-and-forth. The goal is a system where the right person is notified at the exact right moment with everything they need.
This flow chart breaks down a typical test execution cycle. Automation is what glues these stages together, making the transition seamless.
Building an Automated Handoff from Dev to QA
Here's an actionable automation recipe using a Jira app like Nesty. When a developer drags a user story into the "Ready for Test" column, a chain of actions kicks off automatically.
This is more than just changing the assignee; it's delivering a complete package to the tester.
The Trigger: An issue transitions to the "Ready for Test" status.
Assign Instantly: The ticket is immediately reassigned to the QA Lead or a designated tester. No more ambiguity.
Notify the Team: A message instantly pings a specific Slack channel (e.g., #qa-team), tagging the new assignee with a direct link: "@jane.doe – US-123 'User Login Flow' is ready for testing."
Attach the Goods: The workflow can automatically attach the latest build artifacts, ensuring the tester has the right version.
This one automation eradicates missed handoffs and the "is this ready yet?" chatter. It's a fundamental step for how to improve team collaboration in a fast-moving environment.
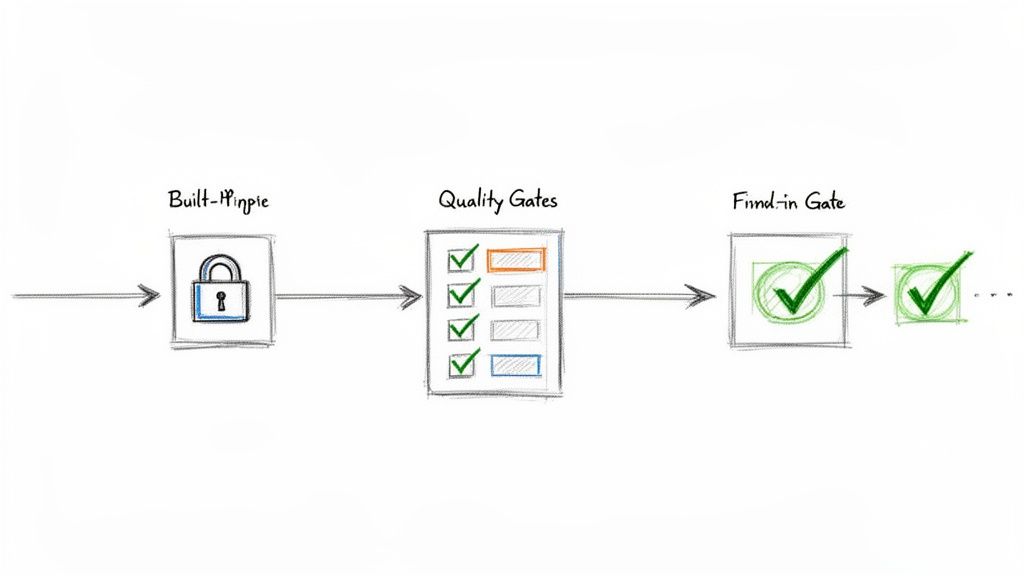
Enforcing Quality with Automated Gates
A quality gate is a checkpoint—an automated rule that prevents a ticket from moving forward until certain conditions are met. It’s your workflow’s enforcer. One of the most powerful gates prevents a user story from being marked "Done" until every single linked test has passed.
A quality gate acts as your workflow's conscience. It doesn't rely on memory or good intentions; it programmatically enforces the Definition of Done, ensuring quality standards are met every single time, without exception.
Using an app like Nesty, you can build this logic directly into Jira. Here's how:
Set the Blocker: Put a blocker on the workflow transition to "Done."
Define the Condition: The blocker stays active as long as any linked test case has a status other than "Pass."
See the Result: A developer literally cannot close the story. When they try, the system stops them and shows a message like, "Cannot be closed. 3 of 5 linked test cases have not passed."
This creates a powerful, self-regulating loop. The burden of checking test results shifts from a person to an automated rule, guaranteeing that buggy code doesn't slip through.
Building Actionable QA Reports and Dashboards
Great testing is invisible without great reporting. If your hard work is buried in individual tickets, it's not helping anyone. The next step is to turn that raw testing data into live dashboards in Jira that tell a clear story about product quality.
The key ingredient here is Jira Query Language, or JQL. Think of it as a super-powered search bar for Jira. You write simple queries to pull exactly the information you need, and these queries become the engine for your dashboard gadgets.
Mastering JQL for QA Metrics
You don't need to be a developer to master JQL. With a few practical, copy-and-paste examples, you can start filtering for the metrics that matter. These queries are the building blocks for creating visual, useful reports.
Here are a few essential JQL queries for QA teams:
Overall Test Status for a Release: Finds all test executions for a specific version. issuetype = "Test Execution" AND fixVersion = "v3.1 Release"
Defects Found in the Current Sprint: Keeps an eye on bug discovery rates. issuetype = Bug AND sprint in openSprints()
Untested Requirements: A lifesaver for finding coverage gaps. It looks for user stories that don't have linked test cases. issuetype = Story AND issue not in hasLinkType("Tests")
Getting comfortable with these simple filters is the first step toward turning data into a clear picture.
From JQL Filters to Powerful Dashboard Gadgets
Once you save a JQL query as a filter, plug it into dashboard gadgets to bring the data to life. This allows stakeholders to see the state of quality at a glance.
Actionable Tip: Set up a dedicated QA dashboard with a mix of these three gadgets for a complete view.
Pie Chart Gadget: Use this for showing test execution status. Plug in your "Overall Test Status" filter to get a simple, color-coded chart showing the percentage of tests that are Pass, Fail, Blocked, and To Do.
Filter Results Gadget: Use this to display a live list of critical defects. Create a filter like issuetype = Bug AND priority = Highest and display it in a table showing the bug summary, assignee, and status. It keeps everyone accountable.
Two-Dimensional Filter Statistics Table: This is fantastic for pinpointing problem areas. Set it up to show Components on one axis and Status on the other, instantly revealing which parts of the application are generating the most bugs.
A dashboard isn't just a report; it's a conversation starter. When a product manager sees a pie chart with a giant red slice for "Failed Tests," it forces an immediate and necessary discussion about release readiness.
This visibility is a major benefit of managing test cases inside Jira with a purpose-built tool. Real-world stats show that integrated systems can slash testing overhead by 35%. That efficiency helps scrum teams ship 22% faster while maintaining 95% traceability—critical for regulated industries. You can find more details in these findings on integrated QA solutions.
By creating these dashboards, you give the entire team the context to make smarter, data-driven decisions, understand risks, and ultimately, ship with more confidence.
Frequently Asked Questions About Jira Test Management
Even with a perfect system, practical questions always come up. Teams often ask how to handle tricky situations like running the same tests across multiple environments or managing a large regression suite.
Here are answers to the most common questions with battle-tested advice.
How Should We Handle Tests for Different Environments?
You have one test case but need to run it against dev, staging, and UAT. Do not duplicate the test case. This creates a maintenance nightmare.
The best practice is to reuse the same test case but execute it within different Test Cycles. Create a distinct cycle for each environment and pull in the same set of test cases.
Cycle 1: "v4.2 Staging Smoke Test"
Cycle 2: "v4.2 UAT Full Regression"
This keeps your test library clean and follows the DRY (Don't Repeat Yourself) principle. The execution history for staging is tracked in its own cycle, separate from UAT, but the test case itself lives in one central spot.
What Is the Best Way to Manage a Large Regression Suite?
As your product grows, your regression suite will too. Running hundreds of tests every sprint is unrealistic.
The key is to prioritize and categorize your suite. Stop thinking of it as one monolithic block. Actionable Tip: Break down regression tests into smaller, targeted sub-suites using labels or components in Jira.
P1 – Smoke Tests: A small set of mission-critical tests. Run these on every build to catch catastrophic failures immediately.
P2 – Core Functionality: A larger suite covering the most important features. Run this once per sprint to ensure main workflows are solid.
P3 – Full Regression: The entire suite. Save this for right before a major release.
This tiered approach maximizes risk coverage without killing your team's velocity.
How Do We Integrate Automated Tests with Jira?
Getting automated test results into Jira is the final piece of the puzzle. Most modern test automation frameworks can communicate with Jira test management apps via plugins or APIs.
The goal is to have your automated test runs appear in Jira just like manual ones. A typical workflow involves a CI/CD pipeline job that finishes and automatically creates a new Test Cycle in Jira. It then populates that cycle with the test results, marking each as Pass or Fail and attaching logs or screenshots.
The real magic of managing tests in Jira happens when you bring everything together. When your manual test results, automated run data, and all the linked defects live in one place, you get a complete, 360-degree view of product quality. No spreadsheet or standalone tool can come close to that.
The industry has caught on. Data from the Atlassian Marketplace shows test management apps account for 15% of all Jira plugin installs in enterprise companies. This is especially true in the US and Europe, where agile teams now make up 65% of all software projects. You can discover more insights about these Jira trends and see how other teams are centralizing their QA work.
Turn your complex Jira processes into self-managing workflows with Harmonize Pro. Our app, Nesty, helps you automate handoffs, enforce quality gates, and build dynamic checklists that keep your teams aligned and your projects on track. Transform your Jira workflows with Nesty today.
If you've ever tried to wrangle a complex process in Jira using only subtasks, you know the feeling. It's controlled chaos. A proper checklist in Jira is the solution, offering a structured, repeatable, and auditable way to turn a messy ticket into a clear, step-by-step workflow.
Why Your Jira Workflow Needs More Than Subtasks
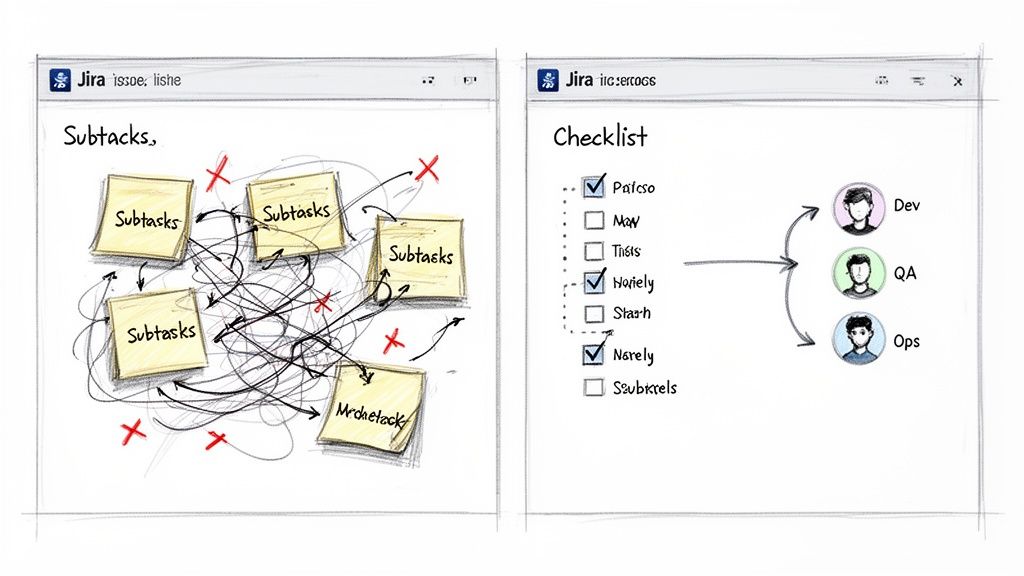
Jira is a powerhouse for tracking big-picture work, but its native features often stumble on the nitty-gritty of process management. Teams frequently resort to creating a blizzard of subtasks or using basic Markdown checkboxes. These "solutions" quickly create noise, clutter backlogs, and lack the structure needed for real process enforcement.
The fundamental issue is that subtasks were built to break down large chunks of work, not to manage a sequential, repeatable checklist. This mismatch is a source of daily frustration for many teams.
The Chaos of Inconsistent Processes
Without a standardized template, every new feature release or customer onboarding becomes an unpredictable adventure. One developer might remember to run security scans, while the next forgets. This isn't just an annoyance; it's a direct threat to quality and a wide-open door for risk. When your Definition of Done (DoD) is just a paragraph buried in a Confluence page, it’s rarely more than a suggestion.
This is exactly where a dedicated checklist app provides immediate, tangible value. You create a master template, and suddenly, every critical step is accounted for—every single time.
Common Pain Points with Native Jira Features
Many teams try to make do with what Jira offers out of the box, only to hit a wall. Here are the all-too-familiar scenarios where native tools fall short:
Messy Dev-to-QA Handoffs: A developer moves a ticket to "Done," but did they update the documentation, deploy to staging, and run all unit tests? A QA engineer shouldn't have to play detective just to start their work.
Error-Prone Onboarding: Getting a new employee or customer up and running involves dozens of small but crucial tasks. Shoving them all into subtasks clogs the project board and makes it impossible to see the big-picture progress at a glance.
No Real Progress Tracking: A Jira issue with 10 subtasks might show 5 are complete, but that 50% figure tells you almost nothing. You can't see the actual progress within the workflow, which makes spotting bottlenecks a guessing game.
For any process demanding consistency and an audit trail, subtasks and basic checkboxes are poor substitutes for a true checklist system. They might look the part, but they fail at reusability and enforcement.
To see the gap clearly, compare what you get with Jira's native tools versus what a dedicated app brings to the table.
Jira Subtasks vs Dedicated Checklist Apps
Capability
Subtasks & Checkbox Fields
Dedicated Checklist Apps
Templates
Manual creation per issue, often copy-pasted
Reusable, dynamic templates applied with automation
Process Gates
Non-existent; relies on manual checks
Hard gates (blockers) that prevent status changes
Automation
Limited to issue-level triggers
Item-level automation (e.g., assign user on check)
Visibility
Clutters backlogs and boards
Contained within the parent issue for a clean view
Audit Trail
Difficult to track who did what, and when
Detailed audit logs for compliance and accountability
Reporting
Basic issue-level reporting only
Granular reports on checklist completion and timings
The difference is clear. While subtasks have their place for breaking down epic-level work, they aren't designed for the detailed, repeatable processes that drive quality and efficiency.
The market has responded to these pain points, pushing many teams to seek specialized solutions. Without checklist apps, teams can burn hours each sprint manually recreating their Definition of Ready/Done lists, leading to massive inconsistencies.
Ultimately, the goal is to build your repeatable, auditable processes right inside Jira. By adopting a dynamic checklist in Jira, you stop managing chaos and start orchestrating clear, predictable outcomes. For more great ideas, take a look at our guide on Jira workflow best practices.
Getting the Most Out of Native Jira Checklist Options
Before installing a specialized app, master the tools Jira already provides. While limited for complex processes, understanding them helps you identify exactly when you’ve outgrown them. Each native option for a checklist in Jira serves a purpose, but they all come with trade-offs.
Let's walk through the three main built-in methods: Markdown checklists, checkbox custom fields, and the classic subtask approach.
Using Markdown for Quick Lists
The fastest way to add a simple to-do list inside a Jira issue is with Markdown. Just type [] for an unchecked box or [x] for a checked one in the description or a comment to create an instant checklist.
This is perfect for one-off, non-repeatable tasks specific to a single issue. Think of a developer jotting down quick reminders for a bug fix: "check logs," "reproduce on staging," "verify fix."
But that simplicity is its biggest weakness. These lists are purely visual.
No Tracking: You can't run a JQL query to find all issues where "Code Review" is still unchecked.
No Automation: Ticking a box can't trigger any action, like reassigning the ticket to the QA team.
No Reusability: The list must be manually typed or pasted into every new issue.
For one-off tasks, Markdown is great. For any repeatable process, it becomes a copy-paste headache.
Setting Up Checkbox Custom Fields
A more structured approach is to use custom fields. Create a field of the "Checkboxes" type and define a standard set of options. For instance, a "Deployment Readiness" field could have options like "Code Merged," "Tests Passed," and "Documentation Updated."
This gives you a consistent set of items on every relevant issue, a significant step up from Markdown. More importantly, because it's a real field, the data is searchable. You can use JQL to find all tickets where "Tests Passed" isn't selected.
The real limitation with custom fields is their flat structure. You can't nest items. This makes them a poor fit for multi-phase processes, like a full feature release that moves from development to QA and then to production.
This rigidity forces you to create either very long, clunky lists or multiple custom fields, adding complexity to your Jira instance.
The Subtask Strategy and Its Pitfalls
For many teams, subtasks are the go-to for breaking down work, and they are often adapted to function as a checklist. You can create a series of subtasks under a parent story, with each one representing a step in your process.
The main advantage here is that subtasks are full-fledged Jira issues. They can be assigned to different people, have their own statuses, and hold attachments, making them powerful for managing handoffs.
The downside? Backlog clutter. A single user story with a 10-step process explodes into 11 separate items on your board. This makes it hard to see the forest for the trees and can turn sprint planning into a nightmare of endless scrolling.
Furthermore, relying heavily on subtasks and custom fields can push you against platform constraints. In 2025, Atlassian updated Jira Cloud's issue limits. The worklog cap was raised to 10,000 per issue, while comments were standardized at 5,000 and attachments at 2,000. For checklist-heavy workflows in DevOps or QA, these limits directly affect usability. Exceeding them can trigger automatic moves to linked issues, disrupting visibility. You can dig into the specifics of these updated Jira Cloud limits and their impact.
Each native option has its place. But when you need structured, repeatable, and nested checklists that don't flood your backlog or force you to worry about instance limits, it's time to look beyond what's built-in.
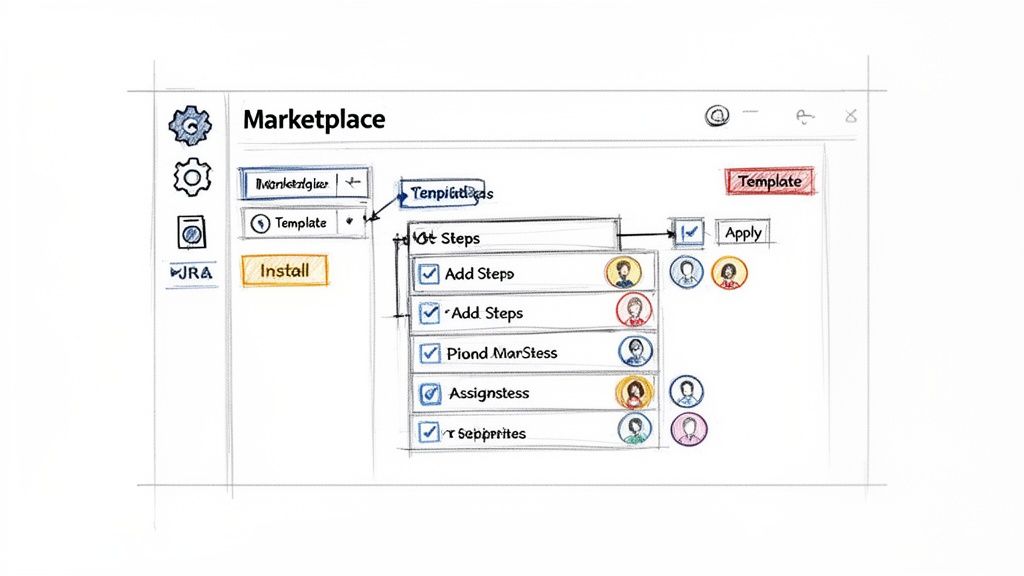
How to Build Your First Dynamic Checklist
Now, let's get practical. To build truly structured, repeatable processes, you need to move beyond Jira's built-in features. By using a dedicated Marketplace app, you can transform a messy ticket into a clear, manageable workflow with a dynamic checklist in Jira. It’s faster and more intuitive than you might think.
Your journey starts in the Atlassian Marketplace, which you can open right from your Jira instance. Go to "Apps" > "Explore more apps" and search for a checklist tool. For this walkthrough, we'll explore features found in powerful apps like Nesty from Harmonize Pro.
Once installed, most apps add a new panel directly into your Jira issue view. This is where you'll build, manage, and reuse your checklist templates without ever leaving the ticket you're working on.
Creating Your First Checklist Template
The template is the heart of a great checklist system. It's a reusable blueprint for a process that ensures every crucial step gets done, every time. Instead of frantically typing out a to-do list for every new bug report, you build the process once and apply it with a click.
Let's walk through creating a "New Feature Deployment" checklist template.
Start with the Big Picture: Inside the template editor, lay out the major stages of your deployment. These will become the top-level parent items. For instance:
Development Phase
QA & Testing Phase
Production Release Phase
Nest the Nitty-Gritty Details: Now, under each phase, add the specific tasks that need to happen. This multi-level structure is something you can't achieve with Jira's basic checkboxes.
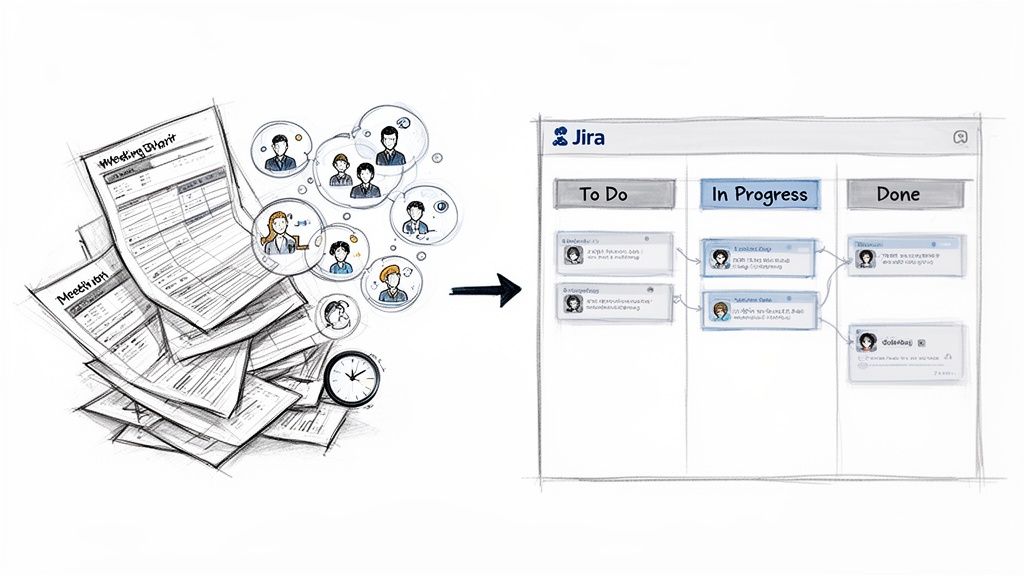
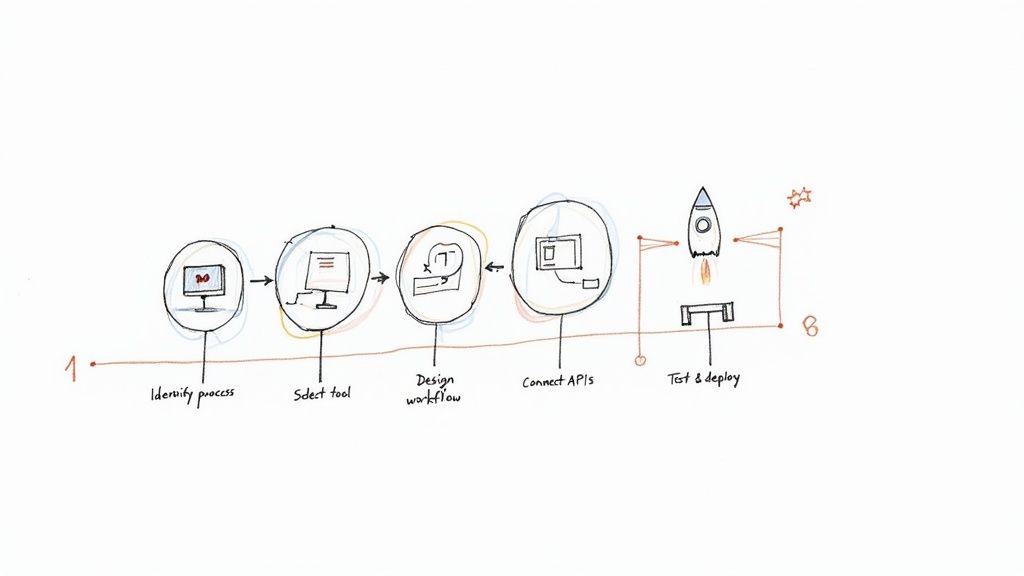
This sketch shows how to turn a whiteboard idea into a structured, multi-level checklist template right inside a Jira app.
It’s a perfect example of moving from a messy process to a clear, hierarchical plan your team can execute.
Fleshing Out the Nested Structure
With your high-level phases in place, add the granular sub-tasks. This is the detail that prevents tasks from being missed when deadlines are tight.
Under "Development Phase," you might add:
[ ] Code review completed by senior dev
[ ] Unit tests written and passing (>90% coverage)
[ ] Merge to main branch
For "QA & Testing Phase," you could add:
[ ] Deployed to staging environment
[ ] Regression testing passed
[ ] User acceptance testing (UAT) sign-off received
And for "Production Release Phase":
[ ] Final deployment to production
[ ] Post-release monitoring initiated
[ ] Announce release in company Slack channel
This nested approach provides a clean, at-a-glance view of the entire process while capturing all critical details.
A well-designed nested checklist transforms a Jira issue from a simple task tracker into a comprehensive project plan. It provides clarity not just on what needs to be done, but in what order and by whom.
Assigning Ownership and Applying Templates
A task list is useless if no one knows who is responsible. Good checklist apps let you assign individual items to specific people directly within the template.
For our deployment example, pre-assign "Code review completed" to the team lead or tag the product manager for "Announce release." The moment that template is applied to a new Jira issue, those assignments are automatically set. The workflow kicks off immediately without manual delegation.
Applying the template is the final step. Most apps let you manually add a saved template to an issue, but the real power comes from automation. Set up a rule so that any time a new issue with the type "Feature" is created, your "New Feature Deployment" checklist is automatically attached.
This simple connection embeds your best practices directly into your team's daily work. You've now built your first dynamic checklist in Jira, turning a chaotic process into a predictable, structured, and auditable workflow.
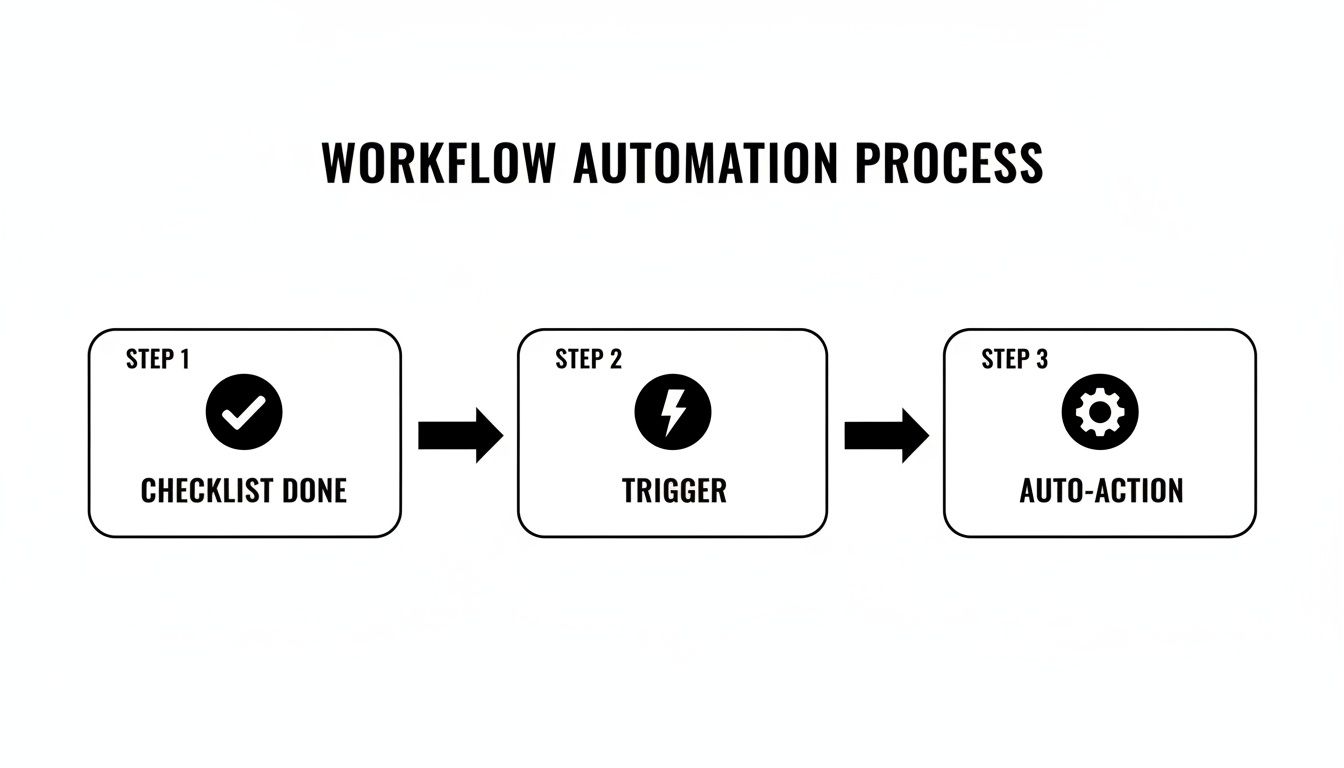
Make Your Checklists Do the Work: Automating Handoffs and Quality Gates
A well-structured checklist is a great start, but a static list still relies on people remembering to check the boxes. The real impact comes when your checklist in Jira actively participates in your workflow. This is how you move from just tracking tasks to building an intelligent process that practically runs itself.
The key is to use features that turn your checklist items into powerful triggers and gates. Instead of just hoping a developer completes all pre-deployment steps, you can make it physically impossible for them to move the ticket to QA until they do. That’s the core of building a self-managing, high-quality workflow.
Use Blockers to Actually Enforce Your Rules
Every team has a Definition of Done (DoD), but ensuring it's followed can feel like a full-time job. A "blocker" feature solves this. It lets you flag certain checklist items as mandatory, preventing a Jira issue from being transitioned until those tasks are complete.
For the classic dev-to-QA handoff, set "Run all unit tests" and "Deploy to staging" as blockers. When a developer tries to move that ticket from "In Progress" to "Ready for QA" without checking those boxes, Jira will reject the transition. It’s a firm but gentle way to enforce your process without nagging.
This logic also applies to your Definition of Ready (DoR). Imagine a checklist that automatically appears on new stories with items like:
Acceptance criteria are defined and clear.
User-facing mockups are attached.
The story has been estimated by the team.
By setting these as blockers for the "To Do" to "In Progress" transition, you stop half-baked work from derailing a sprint before it even begins.
Set Up Smart Triggers for Hands-Free Actions
Once you've established quality gates, the next step is to automate what happens when key milestones are met. Smart triggers let you configure actions based on checklist progress, eliminating manual handoffs at critical points.
This is where your workflow comes alive. Your checklist transforms from a passive list into the engine that drives the issue forward.
A smart trigger turns a completed checklist item into a direct command for Jira. It’s the bridge between a human checking a box and the system taking the next step, ensuring the right person is notified or the right action is taken at exactly the right moment.
For example, in a "Development" section of your checklist, set up a trigger so that when the final item is checked, the issue is automatically reassigned to the lead QA engineer. No more tickets sitting in a queue, waiting for someone to notice they’re ready for testing.
Practical Automation Examples I've Seen Work
The possibilities with triggers are nearly endless, but here are a few real-world examples that solve common bottlenecks:
Automated Slack/Teams Pings: When the "Production deployment complete" item is checked, a trigger can instantly post a message to your team's #releases channel.
Assigning Reviewers: As soon as a developer checks the "Ready for code review" box, a trigger can automatically assign the ticket to another developer for peer review.
Attaching Key Files: In an onboarding checklist, when the "Send welcome packet" item is checked, a trigger can automatically attach the welcome packet PDF to the Jira issue, creating a perfect audit trail.
By 2025, Jira checklist apps have revolutionized bug reporting and onboarding, with standardized templates improving metrics by 45%. Harmonize Pro's Nesty exemplifies this: unlimited nested checklists with triggers cut onboarding from 10 to 4 days, notifying via Slack/Teams and attaching files precisely, reducing errors by 38% in 2025 case studies. You can find out more about how teams are using bug report templates to perfect Jira issues.
These automated handoffs save time and build a more reliable, transparent process. When you combine blockers and triggers, your checklist in Jira evolves from a passive to-do list into an active enforcer of your team's best practices. To go deeper, check out our complete guide to Jira workflow automation.
Practical Checklist Templates for Your Team
Understanding how to build automations is one thing, but knowing where to start can be the hardest part. Staring at a blank slate can be intimidating. To give you a head start, here are three practical, ready-to-use templates for a checklist in Jira.
These are based on real-world workflows that consistently work for software, customer success, and QA teams. Feel free to copy, tweak, and make them your own.
New Feature Release Checklist
Launching new features can be chaotic, with multiple teams juggling tasks and a high risk of things falling through the cracks. This template brings structure to that chaos, ensuring every step from code review to post-launch monitoring is completed. No more "oops, we forgot to update the docs" moments.
Development Phase
Code review completed by a senior developer
Unit tests written and passing (>90% coverage)
Accessibility (a11y) standards met
Merge to main development branch
QA & Testing Phase
Deployed to staging environment
Automated regression suite passed
Manual UAT (User Acceptance Testing) sign-off received
Performance and load testing completed
Production Release Phase
Final deployment to production servers
Post-release health monitoring initiated
Feature flag enabled for target user group
Official release notes published
A standardized release checklist transforms your deployment process from an art into a science. It creates a predictable, low-stress rhythm that improves quality and reduces the risk of last-minute emergencies.
The diagram below illustrates how completing a checklist can kick off an automated workflow, like notifying another team or transitioning the issue's status.
This kind of flow lets the system handle manual handoffs so your team can stay focused on what matters.
Customer Onboarding Checklist
First impressions are everything. A clunky onboarding experience can sour a customer relationship, while a great one is critical for retention. This process often involves a long sequence of tasks, and this template breaks it down into clear, manageable phases to ensure every new customer gets the same stellar kickoff.
A structured approach is also fantastic for internal alignment. To dive deeper, learn more about how to improve team collaboration in our detailed guide.
Here’s how you could structure this in a nested checklist using a tool like Nesty.
Example Customer Onboarding Checklist Template
Phase
Task Item
Sub-Tasks (Example)
Phase 1: Kickoff & Discovery
Conduct Kickoff Call
– Schedule call with all stakeholders – Prepare and send agenda – Document meeting notes and action items
Gather Requirements
– Send customer requirements questionnaire – Review responses with internal team – Define success criteria and KPIs
Phase 2: Technical Setup
Provision Account
– Create customer account in production – Apply correct subscription/license level – Configure initial permissions
Configure Settings
– Implement settings from discovery notes – Set up necessary integrations – Provide user credentials securely
Phase 3: Training & Go-Live
Conduct User Training
– Schedule primary user training session – Deliver training based on their use case – Record session and share with customer
Transition to Support
– Confirm go-live date with customer – Introduce them to their support contact – Send welcome email from support team
This level of detail ensures nothing is missed and provides a clear, repeatable path to success for every new client.
Bug Triage Checklist
When a bug report lands, the clock starts ticking. QA teams need a consistent way to gather essential information immediately. Without a solid process, developers waste time chasing down missing details, slowing down the entire resolution cycle. A bug triage checklist ensures every report is properly vetted and categorized before it hits the dev backlog.
Initial Verification
Confirm the bug can be reproduced on the latest version
Check for duplicate bug reports
Gather logs and console errors from the reporter
Information Gathering
Document clear, step-by-step instructions to reproduce
Attach relevant screenshots or screen recordings
Identify the browser, OS, and device where the bug occurs
Prioritization & Assignment
Assign a severity level (e.g., Critical, Major, Minor)
Assign a priority level based on business impact
Add relevant component or team labels
Assign the ticket to the appropriate development team or backlog
Using a standardized checklist in Jira for bug triage means developers get high-quality, actionable reports every time. This cuts down the back-and-forth and lets them get straight to fixing the problem.
Common Questions About Jira Checklists
As teams begin to structure their workflows, a few questions about using a checklist in Jira consistently arise. Getting clear answers is key to moving forward with confidence and avoiding common pitfalls. Here's what I hear most often.
Can I Import Checklists from Excel or a CSV File?
Yes, but only if you have the right tool. This is a common need, especially when migrating existing processes into Jira. Jira's native options lack an import feature, but this is a core function for many apps on the Atlassian Marketplace.
Apps like Nesty typically let you paste a list directly from a text file or use an import wizard. This is a massive time-saver, turning old process documents into dynamic Jira checklist templates in seconds and saving you from rebuilding them line by line.
How Do Checklist Apps Affect Jira Performance?
It’s a smart question. No one wants to install an app that slows down their Jira instance. Modern, well-built checklist apps are designed to be extremely lightweight.
The secret is how they handle data. Instead of cluttering issues by creating hidden custom fields or subtasks, they manage checklist information within their own architecture. This design keeps your Jira issues lean and prevents you from hitting instance limits on worklogs, comments, or attachments, even with incredibly detailed checklists.
This architectural choice is a major differentiator between a robust, enterprise-ready app and a simpler solution.
Is It Possible to Report on Checklist Progress?
Absolutely, but this is where you see a huge gap between basic checklists and advanced tools. Native Markdown checklists are purely visual and offer zero reporting. You can't query if an item is checked off or track completion rates across projects.
Dedicated apps excel here. They often include built-in progress bars on the issue view and, more importantly, their own custom JQL functions. This unlocks powerful filters, custom dashboards, and detailed reports. For example, you can build a filter to instantly find all open tickets where the "Security Review" checklist item is still unchecked.
What Is the Difference Between DoR and DoD Checklists?
This is a cornerstone concept for agile teams, and understanding the distinction is crucial. Both are quality gates, but they operate at opposite ends of your workflow.
Definition of Ready (DoR): This is the entry gate. It's a checklist that ensures a story is truly ready for development before any work begins. Does it have clear acceptance criteria? Are the designs attached? A solid DoR prevents half-baked tasks from entering a sprint.
Definition of Done (DoD): This is the final inspection. The DoD checklist confirms that all required steps—like code reviews, QA testing, and updating documentation—are complete before the issue can be closed. It prevents incomplete work from being shipped.
By using a dedicated app to build and enforce both DoR and DoD checklists, you create a powerful quality framework that maintains high standards from the moment a ticket is created to the moment it's closed.
Ready to turn your Jira issues from simple to-do lists into dynamic, self-guiding workflows? Harmonize Pro's Nesty app lets you build unlimited nested checklists with powerful automation to enforce your processes, automate handoffs, and keep your teams perfectly aligned. Discover what Nesty can do for you.
In complex software development, a robust audit trail is the bedrock of accountability, security, and compliance. It is not just a passive record of what happened; it is the definitive source of truth for every change, handoff, and decision made within your workflows. For teams relying on Jira to manage intricate processes, a weak audit trail introduces significant risk. It can lead to security vulnerabilities, compliance failures, and hours of wasted time on forensic investigations when something goes wrong.
This is especially critical when using powerful apps like Harmonize Pro (Nesty) to manage multi-step, customer-facing handoffs. Without a clear and immutable record, verifying who did what, when, and why becomes nearly impossible. A simple log file is no longer sufficient to meet modern security and operational demands. Instead, you need a comprehensive strategy that treats your audit trail as a critical security asset.
This guide moves beyond generic advice to provide a roundup of actionable audit trail best practices. We will explore specific, practical strategies that you can apply directly within your Jira environment. You will learn how to:
Implement immutable logs and granular access controls.
Establish real-time monitoring and anomaly detection.
Automate compliance reporting and integrate with incident response.
Securely manage log retention and transmission.
By the end of this article, you will have a clear framework for transforming your Jira instance into a bastion of transparency and control, ensuring your development lifecycle is both efficient and verifiably secure.
1. Immutable Audit Logs with Comprehensive Event Capture
The foundation of any robust audit trail is immutability and comprehensiveness. This practice involves creating a permanent, tamper-proof record of every significant event within a system. An immutable log cannot be altered or deleted once written, ensuring the integrity and historical accuracy of the data. Comprehensive capture means logging not just the "what" (the change) but also the "who" (the user), "when" (the timestamp), and "how" (the specific modification details).
For teams using Jira, this goes beyond native issue history. It includes tracking every rule execution in Jira Automation, every permission change, and every configuration update. When using powerful workflow apps like Harmonize Pro (Nesty), this extends even further to capture granular activities like the completion of a nested checklist item, the firing of a custom trigger, or an automated handoff between teams. This creates a complete, chronological story of a work item’s lifecycle, which is essential for compliance, security forensics, and process optimization.
Actionable Implementation Tips
To effectively implement this practice, your team should focus on proactive configuration and defense-in-depth strategies.
Configure Logging from Day One: Enable audit logging at application startup, not retroactively. This ensures no data gaps from the very beginning.
Centralize Your Logs: Use a centralized logging solution like Splunk, the ELK Stack (Elasticsearch, Logstash, Kibana), or AWS CloudWatch. This aggregates logs from multiple sources, making them easier to manage, search, and analyze at scale.
Log at Multiple Layers: Capture events at both the application layer (e.g., Jira's audit log) and the database layer. This defense-in-depth approach provides a cross-referenceable record, making unauthorized changes much harder to conceal.
Use Structured Logging: Implement a structured format like JSON for your logs. This makes them machine-readable, which is crucial for automated parsing, analysis, and setting up alerts.
Test Log Integrity: Regularly perform tests to verify that logs cannot be altered. This could involve trying to manually edit log files or running automated scripts to check for hash mismatches, confirming your immutability controls are working.
2. Role-Based Access Control (RBAC) with Audit Separation
Effective audit trail best practices extend beyond just capturing data; they demand strict control over who can access that data. Role-Based Access Control (RBAC) with audit separation establishes granular permissions, ensuring that individuals can only view or manage audit information relevant to their specific role. This principle enforces a critical separation of duties: the individuals performing operational tasks should not have the ability to alter the logs that record their actions, and audit log administrators should not have access to modify operational data.
In a Jira environment, this means configuring permission schemes so that only project administrators or a dedicated compliance team can view the project’s audit log, while developers can only see issue histories. For advanced workflows managed by apps like Harmonize Pro (Nesty), RBAC could mean that a QA lead can view the audit trail for workflow transitions and checklist completions, but cannot access or modify the underlying automation rules or project settings. This segregation is fundamental for preventing unauthorized tampering, limiting data exposure, and upholding the integrity of the audit trail itself, which is a core tenet of compliance frameworks like SOX and ISO 27001.
Actionable Implementation Tips
To implement a strong RBAC model, teams must be deliberate about defining roles and conducting regular reviews to maintain security posture.
Document Role Definitions Clearly: Create an explicit policy that defines each role (e.g., Developer, QA Analyst, Project Admin, Auditor) and documents precisely what audit data they are permitted to access.
Implement a "Least Privilege" Principle: Grant users the minimum level of access necessary to perform their job functions. For instance, create a dedicated "Audit Viewer" role for stakeholders who need visibility into logs but require no modification rights whatsoever.
Centralize Role Management: Whenever possible, use directory services like LDAP or Active Directory to manage roles centrally. This ensures consistency across all connected applications, including Jira and your centralized logging platform.
Conduct Quarterly Access Reviews: Schedule regular reviews of all user permissions. This process helps identify and revoke outdated or excessive access rights, ensuring roles remain appropriate as team responsibilities evolve.
Test RBAC Enforcement: Regularly attempt to access restricted audit data using unauthorized test accounts. These penetration tests validate that your controls are working as expected and identify potential vulnerabilities before they can be exploited.
3. Real-Time Alert and Anomaly Detection
A passive audit trail is useful for historical review, but its true power is unlocked with proactive monitoring. This practice involves continuously analyzing audit logs in real-time to detect suspicious patterns, policy violations, and unauthorized activities, triggering immediate alerts for investigation. Instead of waiting for a periodic review to discover a breach, real-time detection catches issues as they happen, such as unauthorized login attempts, mass permission changes, or unexpected workflow modifications.
This approach combines rule-based alerts for known threats with machine learning to identify behavioral anomalies that traditional checks might miss. For Jira teams, this could mean getting an instant notification when a project's security scheme is altered or when a critical automation rule is disabled. With a tool like Harmonize Pro (Nesty), you can configure highly specific alerts, like notifying a release manager the moment a "Definition of Done" checklist is bypassed. This transforms the audit trail from a reactive forensic tool into a proactive security and compliance mechanism.
Actionable Implementation Tips
To build an effective real-time monitoring system, focus on creating high-fidelity alerts and establishing clear response protocols.
Establish a Behavioral Baseline: Before enabling anomaly-based alerts, monitor your system's logs for a period of 2-4 weeks. This helps your monitoring tool learn what "normal" activity looks like, significantly reducing the rate of false positives once alerting is active.
Create Tiered Alert Severity: Not all alerts are created equal. Categorize them into severity levels like Critical, High, and Informational. A critical alert might be a permission escalation, while an informational one could track a new user login. This helps teams prioritize responses effectively.
Integrate Alerts into Your Workflow: Send notifications directly to the systems your team already uses. Integrate alerts with tools like Slack for immediate team visibility, PagerDuty for critical on-call incidents, or even create a Jira ticket automatically to track the investigation. You can explore how Nesty's platform can trigger custom notifications to keep your team informed.
Include Context in Alerts: An effective alert should answer the key questions: who, what, when, where, and why. A message like "Admin access granted to user 'jdoe' on project 'PROJ' by 'asmith' at 10:15 UTC" is far more actionable than "Permission change detected."
Review and Tune Rules Monthly: Alerting is not a "set and forget" activity. Schedule monthly or quarterly reviews of your alert rules and thresholds. Analyze false positive rates and adjust the logic to improve detection accuracy and reduce alert fatigue.
4. Structured Logging and Centralized Log Aggregation
Managing audit trails across disparate systems is a significant challenge. This practice addresses it by storing logs in a standardized, machine-readable format (like JSON) and aggregating them into a single, centralized repository. Instead of sifting through isolated text files on different servers, teams gain a unified source of truth for investigation, compliance reporting, and security analysis. Structured formats ensure that every log entry is consistent, making event correlation, searching, and filtering dramatically more efficient.
This approach transforms logs from passive records into active intelligence. For instance, a security team could correlate a failed login attempt from a Jira audit log with a simultaneous brute-force alert from a firewall log, all within the same platform like Splunk or the ELK Stack. When using an app like Harmonize Pro (Nesty), structured events detailing granular workflow actions can be streamed alongside infrastructure logs, providing a complete picture of an application's behavior and the user actions that triggered it. This is a core component of modern observability and one of the most effective audit trail best practices.
Actionable Implementation Tips
To successfully implement a centralized logging strategy, focus on standardization and infrastructure from the outset.
Define a Standard Log Schema: Before writing a single log, establish a company-wide schema. Define mandatory fields like timestamp, user_id, event_source, event_type, and trace_id. Use a consistent naming convention, such as snake_case, for all fields.
Use Structured JSON: Adopt JSON as your logging format. It is universally supported, human-readable, and easily parsed by virtually all log management tools, making automated analysis and alerting straightforward.
Implement Reliable Log Shipping: Use log shippers like Fluentd or Logstash to collect and forward logs to your central repository. Configure them to use protocols like TCP that guarantee delivery to prevent log loss during transit.
Encrypt Logs In Transit and At Rest: Protect sensitive audit trail data by enabling TLS for log shipping (in transit) and using server-side encryption in your log aggregation platform (at rest).
Create Pre-Built Dashboards: Build dashboards in tools like Kibana or Datadog for common investigation scenarios, such as tracking a specific user's activity, monitoring failed administrative actions, or visualizing permission changes over time. This accelerates incident response.
5. Retention Policies with Secure Archival and Deletion
An effective audit trail isn't just about what you log; it's also about how long you keep it and how you dispose of it. This practice involves establishing clear, compliant data retention schedules that balance accessibility, storage costs, and privacy obligations. Different data requires different lifecycles; operational logs might be kept hot for 90 days, while logs for SOX compliance must be retained for seven years. A well-defined policy ensures you meet legal requirements without incurring unnecessary storage costs or privacy risks.
This lifecycle management includes two critical phases: secure archival and secure deletion. Secure archival involves moving older, less frequently accessed logs to cost-effective, long-term storage like AWS Glacier, ensuring they remain available for future audits or investigations. Secure deletion guarantees that once a log's retention period expires, it is permanently and irretrievably removed, a key requirement for regulations like GDPR. This systematic approach is a cornerstone of mature audit trail best practices, preventing data sprawl and demonstrating compliance by design.
Actionable Implementation Tips
To build a robust retention strategy, teams must translate policy into automated, verifiable actions.
Map Regulatory Needs to Retention Periods: Create a compliance matrix that explicitly links specific regulations (e.g., HIPAA, SEC Rule 17a-4, GDPR) to the data types they govern and their required retention periods. This document becomes the source of truth for your configuration.
Automate Lifecycle Policies: Implement retention rules as code using infrastructure-as-code tools or cloud-native features. For example, configure AWS S3 lifecycle policies to automatically transition logs from standard storage to an immutable archive tier and then schedule them for deletion.
Use Immutable (WORM) Archival: For long-term storage, use Write-Once, Read-Many (WORM) technologies. This prevents archived logs from being altered or deleted before their designated retention period ends, satisfying strict compliance mandates.
Verify Deletion Procedures: Regularly test your secure deletion processes in a non-production environment. This confirms that the mechanisms work as expected and provides evidence that you can fulfill data erasure requests, such as those under the "right to be forgotten." For details on how data is managed, you can review our comprehensive privacy policy.
Document Everything: Maintain clear, accessible documentation of your retention policies, archival procedures, and deletion protocols. This is crucial for demonstrating compliance during an audit and for internal governance.
6. Audit Log Integration with Incident Response Workflows
An audit trail's true value is realized when it moves from a passive, historical record to an active component of your operational processes. This practice involves connecting audit logs directly to incident management workflows, enabling teams to rapidly investigate and resolve issues. Instead of being siloed, logs are integrated with ticketing systems like Jira, collaboration tools like Slack, and incident management platforms like PagerDuty. This integration ensures that when an anomaly or production issue occurs, the relevant audit trail data is automatically surfaced within the incident context, dramatically accelerating timeline reconstruction and root cause analysis.
For software teams, this means a critical GitHub security alert can automatically create a high-priority Jira ticket pre-populated with the relevant commit and user data. In the context of complex workflows, a process failure within an app like Harmonize Pro (Nesty) could auto-generate a Jira incident ticket that includes a snapshot of the audit trail leading up to the failure. This seamless flow of information empowers incident responders with the immediate context they need, transforming the audit log from a forensic tool into a real-time diagnostic asset.
Actionable Implementation Tips
To effectively integrate your audit trail with incident response, focus on automation and context-rich data delivery.
Start with Critical Events: Begin by integrating only high-severity alerts, such as security vulnerabilities or critical system failures. This prevents alert fatigue and ensures your team focuses on what truly matters.
Use Templated Incident Creation: Configure your integrations to create incidents using a standardized template. This ensures every ticket includes essential context fields like the affected user, resource, timestamp, and a summary of the logged action.
Automate Timeline Creation: Set up your incident management tool to automatically pull in related audit events from a defined time window around the incident. This provides an instant, chronological view of what happened before and after the alert.
Link Back for Deep Dives: Ensure every automated incident ticket includes a direct link back to a pre-filtered search in your centralized logging platform (e.g., Splunk or Kibana). This allows responders to seamlessly transition from the high-level summary to a detailed investigation.
Incorporate Logs into Post-Incident Reviews (PIRs): Update your PIR or post-mortem templates to include a mandatory section for analyzing the audit log data. This formalizes its role in learning from incidents and improving system resilience.
7. Audit Log Analysis and Compliance Reporting Automation
A proactive approach to audit trail best practices moves beyond simple log collection to automated analysis and reporting. This practice involves building automated workflows that continuously scan audit logs to generate compliance reports, assess the effectiveness of internal controls, and identify significant trends. Instead of enduring labor-intensive manual reviews for audits, this method programmatically evaluates whether systems are operating within policy and automatically surfaces reportable findings, transforming compliance from a periodic event into a continuous process.
This continuous monitoring is essential for frameworks like SOX, HIPAA, and PCI-DSS, which demand documented evidence of control operation. For example, an automated system can parse Jira audit logs to generate a monthly report verifying that all user access changes were properly approved, satisfying a key HIPAA administrative safeguard. Similarly, a workflow built with a tool like Harmonize Pro (Nesty) can automatically report on "Definition of Done" enforcement rates across projects, providing tangible evidence of process adherence for internal or external auditors. This shifts the audit posture from reactive and stressful to proactive and predictable.
Actionable Implementation Tips
To effectively automate analysis and reporting, focus on high-risk areas first and build systems that produce auditor-friendly outputs.
Start with High-Risk Controls: Begin by automating the analysis for your most critical compliance controls, such as user access reviews, change management approvals, or segregation of duties policies. This delivers the highest value and risk reduction upfront.
Document Control Objectives Clearly: For each automated report, explicitly document the control objective it addresses and the specific testing procedure the automation performs. This provides clear context for auditors.
Build Auditor-Friendly Reports: Design automated reports in formats that auditors expect, such as evidence matrices or exception lists. This simplifies their review process and demonstrates a mature compliance program.
Implement Trend Detection: Configure your analysis tools to identify patterns over time, such as an increase in failed login attempts or a degradation in process compliance. This helps you spot systemic issues before they become major incidents.
Integrate with GRC Platforms: If you use a Governance, Risk, and Compliance (GRC) tool like ServiceNow GRC, pipe your automated report outputs directly into it. This creates a centralized, authoritative system of record for all compliance activities.
Schedule for a Predictable Cadence: Run your automated reports on a regular, predictable schedule (e.g., weekly, monthly, quarterly). This ensures a consistent and reliable stream of compliance evidence.
8. Secure Log Transmission with Encryption and Integrity Verification
Audit logs are not just historical records; they are sensitive data that can reveal system vulnerabilities, user behavior, and critical business information. This practice focuses on protecting logs while they are in transit from their source to their final storage destination. Transmitting them over unencrypted channels is a significant security risk, exposing them to interception, analysis, and malicious alteration. Secure log transmission ensures that data remains confidential, its integrity is maintained, and its origin is authenticated.
This is a critical step in maintaining a chain of custody for your audit data. For Jira teams, this means ensuring that logs from the Jira application, as well as integrated tools like Harmonize Pro (Nesty), are sent to a centralized logging system over a secure, encrypted channel. For instance, logs detailing workflow changes or permission updates must be protected as they travel from your Jira Data Center instance to Splunk or an ELK Stack. Without this protection, an attacker could potentially capture or modify these logs mid-transit, undermining the entire audit trail.
Actionable Implementation Tips
To secure your log transmission pipeline, focus on layering modern encryption standards with strong authentication and verification mechanisms.
Enforce Strong TLS Protocols: Mandate the use of TLS 1.2 or, preferably, TLS 1.3 for all log forwarding. Explicitly disable outdated and vulnerable protocols like SSLv3, TLS 1.0, and TLS 1.1 in your server and client configurations.
Implement Mutual TLS (mTLS): For high-security environments, use mTLS where both the log shipper (client) and the log collector (server) must present valid certificates to authenticate each other. This prevents unauthorized systems from sending or receiving logs.
Use Log File Validation: Enhance integrity by using digital signatures or checksums (like SHA-256 hashes) for log batches. The receiving system can then validate the signature to ensure the logs were not tampered with during transit. AWS CloudTrail's log file validation feature is a great example of this in practice.
Regularly Rotate and Manage Certificates: Automate the rotation of your TLS certificates well before they expire. Set up monitoring to alert your team at least 30 days in advance to prevent service disruptions caused by expired certificates.
Monitor for Transmission Failures: Actively monitor your log shipping agents for failed transmission attempts. A sudden spike in failures could indicate a network issue, a misconfiguration, or a potential man-in-the-middle attack. To see how we manage data in transit, you can learn more about our comprehensive security policy.
8-Point Audit Trail Best Practices Comparison
Practice
Implementation Complexity 🔄
Resource & Cost ⚡
Expected Outcomes ⭐📊
Ideal Use Cases 💡
Key Advantages ⭐
Immutable Audit Logs with Comprehensive Event Capture
High 🔄🔄🔄 — design for immutability and full capture
High ⚡⚡⚡ — storage, indexing, integrity checks
Full traceability and forensic-ready records (⭐⭐⭐⭐⭐)
Navigating the complexities of modern software development requires more than just efficient workflows; it demands a foundation of trust, transparency, and accountability. Throughout this guide, we've explored the critical components of a robust logging strategy, moving beyond the basics to detail truly effective audit trail best practices. We have dismantled the idea of an audit trail as a mere compliance checkbox and rebuilt it as a powerful strategic asset for any team using Jira.
The journey from a reactive logging system to a proactive intelligence engine is paved with specific, deliberate actions. It begins with establishing immutable, comprehensive logs that capture every meaningful event, creating an unalterable source of truth. It's reinforced by implementing stringent Role-Based Access Control (RBAC) and securing logs with end-to-end encryption and integrity verification, ensuring that sensitive data is protected from unauthorized access and tampering.
From Data Points to Actionable Insights
However, capturing data is only half the battle. The true value emerges when you transform that data into actionable insights. This is where best practices like structured, centralized logging and real-time anomaly detection become game-changers. By standardizing your log formats and aggregating them in a single, searchable system, you empower your teams to:
Accelerate Incident Response: Instead of manually sifting through disparate log files across different systems, engineers can immediately query a centralized repository to pinpoint the root cause of a production issue, drastically reducing Mean Time to Resolution (MTTR).
Enhance Security Posture: Automated alerts for suspicious activities, such as repeated failed login attempts or unauthorized permission changes, allow your security team to proactively investigate and neutralize threats before they escalate into significant breaches.
Streamline Compliance: Automating the generation of compliance reports for standards like SOC 2, ISO 27001, or HIPAA transforms a dreaded, time-consuming process into a routine, push-button operation. This ensures you're always audit-ready.
Making Auditability an Inherent Part of Your Workflow
Ultimately, the goal is to weave these audit trail best practices so deeply into your operational fabric that they become second nature. This involves defining clear retention policies for secure archival and establishing seamless integrations with incident response workflows. When an alert fires, it should automatically trigger a predefined process, such as creating a high-priority Jira ticket, notifying the on-call engineer via Slack, and initiating a security playbook.
This level of integration and automation ensures that your audit trail is not a dusty archive but a living, breathing component of your daily operations. It provides the visibility needed to refine processes, the accountability required to build secure systems, and the evidence necessary to prove compliance without derailing productivity. By adopting this holistic approach, you elevate your audit trail from a simple historical record to a dynamic tool that fosters operational excellence, enhances security, and builds unwavering trust with your customers and stakeholders. The investment in a world-class audit system pays dividends in resilience, efficiency, and a stronger competitive edge.
Ready to implement these best practices directly within your Jira workflows? Harmonize Pro's Nesty empowers teams to build tamper-evident, automated, and compliant audit trails for their most critical processes. Explore Harmonize Pro to see how you can turn auditability into your next strategic advantage.
Improving team collaboration isn't a theoretical exercise; it's a direct investment in your bottom line. To get there, you need to define clear processes, automate manual handoffs, and use a single source of truth like Jira to connect every stage of your workflow. This guide provides actionable steps to move your teams from chaotic communication to predictable, high-quality output.
The Hidden Costs of Disconnected Teams
Poor collaboration creates more than just missed deadlines—it silently drains budgets, kills productivity, and damages morale. When your development, QA, and release teams operate in silos, the financial impact is immediate. The biggest sources of friction in software development almost always come back to misaligned handoffs and fragmented communication.
This friction inevitably leads to expensive rework, frustrating delays, and valuable team members leaving. In today's market, these disconnects are no longer just an inconvenience; they are a significant business risk.
The Real Price of Miscommunication
Here’s a common, costly scenario: a developer pushes code to QA without clear testing instructions or confirmation that unit tests passed. The QA team then wastes hours deciphering the feature's purpose or struggling with a broken build. This isn't just a minor delay; it's a domino effect that can push back an entire release.
Every manual, unstructured handoff is a potential point of failure. A forgotten attachment, a vague Slack message, or a ticket dragged to the wrong status can completely derail progress. These small issues accumulate, fostering a culture of confusion and blame.
When teams lack a standardized process, they spend more time coordinating work than actually doing it. This overhead acts as a hidden tax on every project, eating into profitability and slowing innovation.
Connecting Collaboration to Business Outcomes
The link between effective teamwork and financial success is clear. With 84% of U.S. employees now working on multiple teams, structured collaboration is essential. A Gallup study of over 183,000 teams found that those with high employee engagement—driven by great collaboration—achieved 23% higher profitability and 18% greater sales productivity than their peers. You can review the full study and its findings to see the full data.
These metrics provide a solid business case for investing in better processes. A structured, automated approach in Jira delivers tangible gains by:
Reducing Rework: Implement clear "Definitions of Done" and automated quality gates to ensure work is completed correctly the first time.
Accelerating Timelines: Eliminate manual handoffs and communication bottlenecks to shorten the entire development lifecycle.
Improving Morale: Provide teams with clear, efficient processes to reduce frustration and increase job satisfaction.
Ultimately, learning how to improve team collaboration is a core strategy for growth. It enables your teams to ship high-quality products faster and more predictably. This guide will show you exactly how to build that framework.
Creating Your Single Source of Truth in Jira
Stop digging through spreadsheets, emails, and Slack channels to find project status updates. When information is scattered, you lose time and risk critical steps falling through the cracks. The first actionable step to improve team collaboration is to establish Jira as your undisputed single source of truth.
By centralizing all conversations, updates, and handoffs in Jira, you create a transparent, auditable record of the entire development lifecycle and eliminate ambiguity.
Map Your Core Processes First
Before configuring Jira, create a blueprint of how your teams actually work. Gather your developers, QA engineers, and release managers to map out every critical process, from the dev-to-QA handoff to multi-environment deployments.
To get an accurate picture, ask specific, direct questions:
What exact steps must a developer complete before passing a ticket to QA?
How does QA signal that a feature is fully tested and ready for the next stage?
What is the step-by-step process for deploying to the staging environment?
Who needs to be notified at each stage, and how does that notification happen now?
This exercise will uncover hidden bottlenecks and incorrect assumptions that are slowing your team down. Documenting these real-world workflows is the essential foundation for effective automation.
Define Your Rules of Engagement
With your processes mapped, establish clear ground rules. The two most critical guardrails are the Definition of Ready and the Definition of Done.
The Definition of Ready (DoR) acts as a gatekeeper, listing the non-negotiable criteria a task must meet before work begins. This prevents half-baked ideas from derailing a sprint.
A practical DoR should require that:
The user story is written and approved by the Product Owner.
Acceptance criteria are clear and testable.
All design mockups are attached directly to the Jira ticket.
The Definition of Done (DoD) is the final checklist confirming a task is 100% complete. It goes beyond "code complete" to ensure you deliver a tested, documented, and shippable piece of work. For more details on this, see our guide on changing a workflow in Jira.
A strong Definition of Done is your team's ultimate quality gate. It’s a shared agreement that eliminates the "it works on my machine" excuse and ensures the final product meets expectations.
Here’s an example of how to build these rules directly into a Jira issue using a tool like Nesty, turning abstract concepts into actionable checklists.
This makes your rules tangible and impossible to ignore by embedding them directly within the ticket where the work happens.
Structure Workflows for Ultimate Clarity
Now, build your mapped processes and rules into a Jira workflow. The goal is a visual path that mirrors your team's real-life handoffs. Replace the generic "To Do → In Progress → Done" with statuses that reflect your unique stages.
Create a workflow with specific statuses like:
Ready for Dev
In Development
Code Review
Ready for QA
In QA Testing
Ready for Staging Deploy
Each transition between statuses represents a meaningful handoff. By building your process directly into Jira, you ensure no one skips a critical step and everyone knows their exact responsibilities at any given time. This is the foundation for predictable delivery.
Automating Handoffs to Erase Manual Work
With a solid workflow in place, you can reclaim your team's most valuable resource: time. Move beyond simply tracking work and start making it move faster. Automating common handoffs eliminates the clumsy, manual steps that create friction and slow everyone down.
Consider the dev-to-QA handoff. Instead of a developer manually reassigning the ticket, @-mentioning the right person, and posting a link in Slack, imagine that entire sequence happening automatically. This is a practical way to turn Jira from a passive logbook into an active project engine.
This diagram shows the three-step approach to building a workflow ready for automation.
Effective automation requires a clear blueprint: first map the real-world process, then define the rules, and finally build that structure in Jira before layering on automation.
The Dev-to-QA Handoff, Perfected
Let's focus on one of the most frequent and error-prone handoffs: moving code from a developer to the QA team. Manual handoffs here often lead to missed notifications, incomplete information, and finger-pointing.
Automating this process ensures nothing falls through the cracks. You can create a rule that triggers the moment a developer completes their "Definition of Done" checklist.
For example, when a developer checks off "Unit Tests Passed," set up an automation rule that instantly:
Changes the ticket status from In Development to Ready for QA.
Reassigns the ticket from the developer to the QA team lead.
Sends a notification to your team's #qa-alerts Slack channel with a direct link to the Jira ticket.
This single rule eliminates three manual steps, making the handoff instant, consistent, and transparent. It's a small change that significantly improves team velocity. To put this into practice, read our article on Jira workflow automation for more detailed examples.
The difference is stark when viewed side-by-side.
Manual vs Automated Handoffs: A Comparison
Compare the old, manual handoff from Dev to QA with a modern, automated approach using a tool like Harmonize Pro / Nesty. The gains in speed and reliability are clear.
Process Step
Manual Handoff (The Old Way)
Automated Handoff (The Nesty Way)
Status Change
Developer manually drags the ticket to a new column.
Automatic: Status changes to Ready for QA once the "Definition of Done" is complete.
Reassignment
Developer searches for the QA lead's name and reassigns.
Automatic: Ticket is instantly assigned to the designated QA team or individual.
Notification
Developer pings QA in Slack or a Jira comment. If they remember.
Automatic: A targeted notification is sent to a specific Slack channel with all context.
Information Check
QA has to manually check for build links, test notes, etc.
Automatic: Handoff is blocked if required fields (like build URL) are empty.
Outcome
Delays, forgotten tickets, and wasted time chasing info.
A seamless, error-proof handoff that happens in seconds.
As the table shows, automation makes the process faster and smarter by building in checks that humans often forget. This is how you begin to scale quality.
Using Triggers to Enforce Quality Gates
Effective automation goes beyond notifications. With a powerful tool like Nesty for Jira, you can set up intelligent triggers that function as automated quality gates, ensuring standards are met without manual oversight.
Imagine a developer attempts to move a ticket to Ready for QA. An intelligent trigger can intervene and check if the prerequisites are met. It can verify:
Is the "Code Review Checklist" fully completed?
Is a link to the build artifact attached?
Are the test environment details filled out?
If any answer is "no," the automation can block the status change and post an automated comment explaining what’s missing. This stops incomplete work from reaching the QA team, saving everyone from frustrating back-and-forth communication.
By automating validation, you turn your process from a suggestion into a self-enforcing standard. The right way becomes the only way.
Eliminating Communication Bottlenecks
Poor communication is a major productivity killer. Data shows 45% of employees say it damages trust, and 90% attribute workplace failures to poor collaboration. Conversely, 76% of teams using project management tools for communication report significant efficiency gains. You can dive into more workplace collaboration statistics for more data.
Automating communication isn't about replacing human interaction; it's about making it more meaningful. Let automation handle repetitive status updates so your team can focus on solving complex problems. It's about delivering the right information to the right person at the right time, transforming chaotic chatter into a predictable flow of information.
Building Quality Gates into Your Workflow
Automating handoffs is a good start, but what if the work being passed along isn't ready? Speeding up a broken process only means you deliver low-quality work to the next stage faster. To truly improve collaboration, you must build quality directly into your workflow.
Quality assurance should be a continuous process, not a last-minute inspection. Quality gates are automated checkpoints that prevent a task from moving forward until specific standards are met, catching problems at the source before they escalate.
From Suggestion to Standard with Checklists
Many teams have a "Definition of Done" (DoD), but it often resides in a forgotten document. To make it effective, embed that DoD as a dynamic checklist directly within your Jira tickets.
With an app like Nesty, you can create nested checklists to break down large quality checks into manageable stages.
For example, a developer's checklist might include:
Code Implementation Complete
Unit Tests Written and Passed
Code Submitted for Peer Review
Sub-task: Peer Reviewer A Approved
Sub-task: Peer Reviewer B Approved
Build Deployed to Dev Environment
This structure provides a real-time view of progress and creates a clear, auditable trail, ensuring every quality step is completed and verified.
Implementing Smart Blockers That Enforce Rules
Smart blockers give your quality gates authority. A smart blocker is an automated rule that physically prevents an issue from changing status until all criteria are met. The system enforces the process, so no individual has to act as the "process police."
For instance, if a developer tries to move a ticket from In Development to Ready for QA, a smart blocker can check:
Is the "Developer DoD" checklist 100% complete?
Is a link to the code repository branch included?
Has the ticket been estimated with story points?
If any of these criteria are not met, the transition fails, and the developer receives an immediate notification explaining what is missing. This contextual feedback ensures no one has to chase down incomplete work.
Smart blockers transform your workflow from a passive record into an active guardian of your team's quality standards. The correct way to do things becomes the only way to do things.
A Real-World Release Management Scenario
Apply this concept to a high-stakes process like a software release. A release ticket involves multiple teams and complex dependencies, making quality gates critical for a smooth deployment.
Consider a release ticket with statuses like Ready for Staging, In Staging, Ready for Production, and Done.
Gate 1 (Moving to In Staging): Block the transition until a "Pre-Staging Checks" checklist is complete. This could include items like "Final build artifacts are attached" and "Release notes are drafted."
Gate 2 (Moving to Ready for Production): Block the transition until the "Staging QA & Sign-off" checklist is fully verified. This list would include crucial steps like "All regression tests passed," "Performance tests successful," and "Product Owner sign-off received."
This proactive approach ensures your release process is followed precisely every time, dramatically reducing human error and preventing bugs from reaching production. Mastering these gates is a key component of Jira workflow best practices.
How to Measure If Better Collaboration Is Actually Working
Implementing new workflows and automation is only half the battle. To prove these changes are effective, you need to track the right metrics. Stop relying on gut feelings and start using hard data to measure your team's performance.
Focus on Key Performance Indicators (KPIs) that directly reflect the health of your collaborative processes. These metrics provide clear evidence that your new systems are reducing friction, increasing speed, and improving work quality.
Metrics That Actually Tell You Something
Move past superficial stats like the total number of tickets closed. To gain real insight, track KPIs that measure the efficiency of your entire development lifecycle.
Here are three essential metrics you can track directly within Jira:
Cycle Time: This measures the total time from when work begins on a ticket ("In Progress") to when it is complete ("Done"). A consistently decreasing cycle time is a strong indicator that your automated handoffs are successfully eliminating bottlenecks.
Rework Rate: Track how often a ticket moves backward in the workflow (e.g., from In QA back to In Development). A high rework rate signals poor communication or unclear requirements. A declining rate shows your "Definition of Done" and quality gates are working.
On-Time Delivery Percentage: Measure the percentage of work your team completes within the planned sprint or release timeline. As collaboration improves, predictability increases, which should be reflected in a higher on-time delivery rate.
These metrics provide a tangible pulse on your team's collaborative health.
Build a Collaboration Dashboard in Jira
Data is only useful if it's visible. Use Jira's native dashboards to create a single source of truth for tracking the performance of your process improvements.
Keep your dashboard focused on key metrics. Use the "Control Chart" gadget to visualize cycle time and the "Created vs. Resolved Chart" to monitor throughput. Seeing these trends daily helps you spot progress and address issues before they become major problems.
Use your Jira dashboard as a conversation starter in retrospectives. Celebrate wins and have honest, data-driven discussions about what needs improvement.
Connecting the Dots to Business Value
Ultimately, you must demonstrate the return on investment (ROI) of your efforts. It's more powerful to present a dashboard showing a 20% reduction in Cycle Time and a 15% drop in Rework Rate than to simply say you "made things smoother."
These metrics translate directly to business value. A lower rework rate means fewer developer hours are wasted fixing preventable bugs, freeing up time for new feature development. A shorter cycle time allows your company to respond faster to market changes and customer feedback, providing a significant competitive advantage.
This is how you prove that investing in a tool like Harmonize Pro / Nesty is not just an expense—it's a strategic move that drives efficiency, quality, and growth.
Got Questions? We’ve Got Answers.
Adopting workflow automation can seem daunting, but it is one of the most impactful changes you can make to improve team collaboration. Here are answers to common questions that arise when teams get started.
"How Can We Start Automating Jira Workflows Without Blowing Up Our Current Sprint?"
The key is to start small and secure a quick win. Do not try to overhaul your entire company's process at once. Instead, identify a single, specific pain point that everyone agrees is a bottleneck.
The classic handoff from Development to QA is an ideal starting point, as it is a frequent source of miscommunication and delays.
Follow this low-risk, four-step approach:
Isolate the experiment. Choose one team or a single project to pilot the new process. This contains the impact and allows you to gather feedback without disrupting other teams.
Use a sandbox. Always build and test new automation in a separate test project. This provides a safe environment to refine the workflow before deploying it to live projects.
Map the real steps. Document the existing process in detail. Identify what the developer does, what information the QA engineer needs, and the exact trigger point for the handoff.
Define a clear trigger. For example, configure the automation to fire when a "Code Review Checklist" is marked complete. This action can then automatically reassign the ticket to the QA lead and notify them via Slack.
This approach demonstrates value on a small scale, minimizing disruption and building momentum for broader adoption.
"What’s the Real Difference Between Jira’s Built-in Automation and an App Like Nesty?"
Jira’s native automation is effective for simple, linear rules, such as "When status changes, add a comment." It is best suited for basic housekeeping and simple alerts.
However, for complex processes with multiple dependencies, conditional logic, and cross-team coordination, you will quickly reach its limits. This is where a dedicated app like Nesty by Harmonize Pro provides a more robust solution designed for intricate, real-world workflows.
A simple analogy: Jira's native automation is like setting a single alarm clock. Nesty is like conducting an orchestra, ensuring every instrument plays its part at the right moment.
Nesty offers advanced capabilities that native functions lack:
Deeply Nested Checklists: Create multi-level checklists to serve as comprehensive, enforceable quality gates.
Dynamic Blockers: Physically prevent a ticket from transitioning until specific criteria are met, turning process suggestions into enforced standards.
Intelligent Multi-Step Triggers: A single action, like completing a checklist, can initiate a cascade of automated actions, such as creating and assigning multiple sub-task checklists to different people across different teams.
For complex processes like customer onboarding or multi-environment releases, this level of control is essential for building a self-managing Jira ticket that guides the entire workflow.
"How Do We Actually Get Our Team to Adopt These New Standardized Processes?"
Adoption hinges on one principle: make the right way the easiest way. If your new, automated process requires less effort than the old, manual one, your team will embrace it.
First, involve the team in the design process. When people help build the workflow, they gain a sense of ownership and ensure it solves their actual problems, not just perceived ones.
Next, highlight the personal benefits. Show a developer how completing one checklist eliminates three manual tasks they dislike, such as updating the ticket status, reassigning it, and notifying the QA team. They will see the new process as a time-saving tool, not just another layer of bureaucracy.
Finally, use features like Nesty's blockers to guide behavior. When an issue cannot be moved forward until the "Definition of Done" is met, the process enforces itself. This creates consistency and ensures quality is built-in from the start, which ultimately makes everyone's job easier.
Ready to stop talking about process and start building self-managing workflows? With Harmonize Pro, you can create the intelligent, automated handoffs and quality gates that keep your teams in sync and shipping better work, faster.
In modern software development, the speed of delivery is matched only by the demand for quality. Yet, countless engineering hours are lost to a common, persistent bottleneck: mismanaged test environments. Issues like configuration drift, data inconsistencies, and manual handoffs create friction, delay releases, and allow critical bugs to slip into production. The difference between a high-performing team and a struggling one often lies in their approach to testing infrastructure. A robust strategy for test environment management is no longer a luxury; it is a fundamental component of a successful delivery pipeline.
This guide moves beyond theory to provide a definitive roundup of actionable test environment management best practices. We will explore 8 critical strategies that you can implement today to build a more resilient, efficient, and reliable workflow. You will learn how to:
Achieve perfect environment parity and eliminate configuration drift.
Automate provisioning and teardown to save time and reduce costs.
Master test data management for consistent, reliable testing outcomes.
Implement proactive monitoring to catch issues before they impact your team.
Streamline handoffs between development, QA, and release teams.
By mastering these practices, you can eliminate rework, accelerate feedback loops, and empower your teams to ship with confidence. This listicle is designed for software teams, DevOps engineers, and QA professionals who need practical, specific steps to transform their testing infrastructure from a source of frustration into a strategic asset. Let's dive into the core practices that will stabilize your environments and supercharge your release velocity.
1. Environment Parity and Configuration Management
The infamous "it works on my machine" problem is a classic source of friction between development and operations teams. This issue almost always stems from a lack of environment parity: subtle (or significant) differences between development, staging, and production environments. Achieving parity means ensuring that every environment, from a local developer laptop to the final production server, is as identical as possible. This consistency is a cornerstone of effective test environment management best practices.
It covers everything from operating system versions and patch levels to installed libraries, application dependencies, network configurations, and third-party service endpoints. By standardizing these elements, you create a predictable and reliable pipeline where a test passed in a lower environment provides a high degree of confidence that the code will behave exactly the same in production. This minimizes deployment-day surprises, reduces bug resolution cycles, and accelerates the entire software delivery lifecycle.
Why It's a Top Priority
Maintaining environment parity is crucial because it validates the integrity of your entire testing process. Without it, you are not truly testing how your application will perform live. A test that passes in a staging environment with a different database version or API dependency than production is, at best, an approximation. At worst, it provides a false sense of security, allowing critical bugs to slip through unnoticed.
Cloud-native leaders have championed this practice for years. For instance, Spotify uses Infrastructure as Code (IaC) to programmatically define and provision identical staging and production setups, while Amazon leverages AWS CloudFormation templates to spin up consistent, on-demand test environments that mirror their live infrastructure.
Actionable Implementation Tips
Achieving and maintaining parity requires a deliberate, tool-driven strategy. Here’s how to implement it effectively:
Embrace Containerization: Use Docker to package your application and its dependencies into a single, portable container. Define your environment in a Dockerfile and share it across all teams to ensure identical runtimes everywhere, from local development with Docker Compose to production clusters managed by Kubernetes.
Implement Infrastructure as Code (IaC): Use tools like Terraform or Ansible to define your infrastructure (servers, load balancers, databases) in version-controlled configuration files. This makes provisioning a new, identical environment a repeatable command like terraform apply.
Version Control All Configurations: Store all environment configuration files—not just application code—in a Git repository. This includes Dockerfiles, Terraform scripts, and application settings. Use a pull request workflow for all changes to ensure peer review and a complete audit trail.
Automate Environment Audits: Write scripts to periodically check for "configuration drift." For example, create a scheduled CI/CD job that uses aws cli or az cli to compare the live state of your cloud resources against your Terraform state file and alert on any discrepancies.
2. Automated Test Environment Provisioning
The days of manually configuring servers and waiting days for a new test environment are over. Modern software delivery demands speed and agility, which is where automated test environment provisioning becomes a non-negotiable practice. This approach involves using code and automation tools to create, configure, and tear down complete, isolated test environments on-demand. By scripting the entire process, teams can eliminate manual effort, drastically reduce human error, and accelerate feedback loops.
This automation is the engine behind modern Continuous Integration/Continuous Delivery (CI/CD) pipelines. Instead of sharing a single, static staging environment that often becomes a bottleneck, developers can spin up a fresh, pristine environment for every feature branch or pull request. This ensures tests are run in a clean, isolated state, free from the interference of other ongoing work, making it a cornerstone of effective test environment management best practices.
Why It's a Top Priority
Automated provisioning directly impacts development velocity and testing reliability. When environments are created manually, they are slow to build, prone to configuration drift, and costly to maintain. Automation transforms them into ephemeral, disposable resources that can be summoned in minutes and destroyed just as quickly, optimizing resource usage and cost. This enables parallel testing at a massive scale, which is impossible with manual methods.
Hyperscalers have perfected this approach. For example, GitHub Actions can automatically spin up ephemeral test environments for each pull request, providing immediate feedback. Similarly, Google Cloud and AWS leverage their native Infrastructure as Code (IaC) tools, Terraform and CloudFormation respectively, to provision complex test infrastructures on-demand for thousands of concurrent test runs. Learn more about the core principles of automating complex workflows to see how this fits into a broader strategy.
Actionable Implementation Tips
Adopting automated provisioning requires a shift to an "everything as code" mindset. Here are practical steps to get started:
Define Infrastructure as Code (IaC): Start by writing Terraform or AWS CloudFormation scripts that define your complete environment, from virtual machines and networks to databases. Commit these scripts to a Git repository alongside your application code to keep them in sync.
Leverage Containerization: Use Docker and a docker-compose.yml file to define how your application and its dependent services run together. Containers provide lightweight, fast-starting, and isolated runtimes that are perfect for ephemeral test environments.
Integrate with Your CI/CD Pipeline: Create a job in your Jenkins, GitLab CI, or GitHub Actions workflow that runs terraform apply to build the environment whenever a new pull request is opened. This job should run before the testing stage.
Automate Cleanup: Implement an automated teardown job that runs terraform destroy after tests are complete or when a pull request is merged/closed. This crucial step prevents orphaned resources, avoids resource leaks, and minimizes cloud costs.
Secure Your Secrets: Do not hardcode secrets. Use a dedicated secrets management tool like HashiCorp Vault or AWS Secrets Manager. Your CI/CD pipeline should fetch secrets at runtime and inject them into the environment as environment variables.
3. Test Data Management and Isolation
Unreliable test results are often not a code problem but a data problem. When tests interfere with each other by modifying the same dataset, or when test data is inconsistent, the entire testing process becomes fragile and untrustworthy. Test data management and isolation is the practice of creating stable, repeatable, and isolated datasets for testing activities. It ensures that each test run starts from a known state and does not impact other concurrent tests, which is a cornerstone of reliable automated testing.
This discipline involves generating predictable datasets, masking sensitive information to comply with regulations like GDPR and HIPAA, and resetting the environment's state after each test. Proper test data management prevents data contamination, ensures tests are deterministic, and allows for parallel execution without conflict. It is fundamental to building a robust and scalable CI/CD pipeline and is a critical component of any mature test environment management best practices strategy.
Why It's a Top Priority
Effective test data management is crucial because it directly impacts the reliability and validity of your test outcomes. Without it, you face flaky tests that fail intermittently for no clear reason, leading to wasted engineering time and a loss of confidence in your test suite. A test that passes only because it ran before another test that corrupted its data provides a false positive, while a failure caused by bad data creates a false negative, masking the real quality of the code.
Leading technology and financial companies treat test data as a first-class citizen. For example, Stripe generates synthetic data that mimics real-world payment patterns, allowing them to test complex transaction scenarios without ever touching real customer information. Similarly, major financial institutions use sophisticated data masking and subsetting tools to create realistic, anonymized datasets for performance testing, ensuring they meet strict PCI compliance standards.
Actionable Implementation Tips
Implementing a robust data strategy requires a combination of tooling and defined processes. Here’s how to do it effectively:
Generate Data Programmatically: Instead of relying on static seed files, use libraries like Faker (for many languages) or built-in test data factories in frameworks like Ruby on Rails or Laravel to generate fresh, realistic data for each test run. This makes tests self-contained and easy to understand.
Leverage Database Snapshots: For integration tests, use tools like TestContainers to spin up an ephemeral database in a Docker container for each test suite. Before each test, restore a known-good database snapshot to ensure a perfectly clean slate every time.
Isolate Test Database Instances: Never share a test database. As part of your automated environment provisioning, include a script that creates a dedicated database instance for that specific test run. The database credentials should be dynamically generated and passed to the application.
Mask and Anonymize PII: When using production-like data, use tools like Tonic or Spherity to systematically find and replace personally identifiable information (PII) before loading it into a non-production environment. This is non-negotiable for complying with data privacy laws.
4. Environment Monitoring and Health Checks
A test environment is only useful when it is stable, available, and performing as expected. Intermittent failures, slow response times, or unexpected downtime can derail testing schedules, create false negatives, and erode trust in the QA process. Continuous monitoring and automated health checks are essential test environment management best practices that transform environment stewardship from a reactive, fire-fighting exercise into a proactive, preventative discipline.
This practice involves actively tracking the state of your test environments by collecting and analyzing a wide range of metrics. It covers everything from infrastructure health (CPU, memory, disk space) to application performance (response times, error rates) and the availability of critical dependencies like databases and third-party APIs. By establishing a baseline for normal behavior, you can automatically detect anomalies, diagnose root causes faster, and resolve issues before they block entire teams.
Why It's a Top Priority
Proactive monitoring is critical because it prevents test flakiness and saves countless hours of debugging. When a test fails, the first question should be "Is it the code or the environment?" without solid monitoring, teams waste valuable time investigating environmental issues disguised as application bugs. A healthy environment ensures that test results are reliable, which is the entire purpose of the testing phase.
Industry leaders treat their test environments with the same operational rigor as production. Netflix, for example, employs sophisticated health checks to detect service degradation in its complex microservices architecture, ensuring test environments accurately reflect production behavior. Similarly, Slack provides internal status dashboards for all service dependencies, allowing engineers to immediately verify environment health before starting a test run.
Actionable Implementation Tips
Implementing a robust monitoring strategy requires a combination of the right tools and a clear plan. Here’s how to get started:
Implement Application Health Check Endpoints: In each service, create a dedicated API endpoint like /health that checks its internal state and dependencies (e.g., database connectivity) and returns a simple 200 OK or 503 Service Unavailable. Your CI/CD pipeline should poll this endpoint before running tests.
Combine Infrastructure and Application Metrics: Use a monitoring tool like Datadog, New Relic, or an open-source stack like Prometheus and Grafana to create a dashboard. This dashboard should display both system metrics (CPU, RAM) and key application metrics (HTTP 5xx error rates, API latency) in one place.
Set Up Meaningful, Actionable Alerts: Configure alerts to notify your team's Slack or PagerDuty channel when a critical metric breaches a threshold (e.g., CPU utilization > 90% for 5 minutes). Ensure alerts include context and a link to the dashboard to speed up troubleshooting.
Monitor Third-Party Dependencies: Your application's health depends on external services. Use synthetic monitoring tools like Checkly or Uptrends to continuously ping the health endpoints of critical third-party APIs your test environment relies on.
Automate Common Remediation Tasks: Write simple scripts that can be triggered automatically by alerts to perform basic remediation. For example, if a "disk full" alert fires, a script can automatically run to clear old log files or temp directories.
5. Clear Definition of Ready and Definition of Done for Environments
A common source of wasted cycles and team frustration is starting tests in an environment that isn't fully prepared or, conversely, promoting code before it has been thoroughly validated. To prevent this, leading teams borrow concepts from Agile methodologies, establishing a clear Definition of Ready (DoR) and Definition of Done (DoD) specifically for test environments. This practice introduces formal, agreed-upon quality gates that ensure an environment is stable and configured correctly before testing begins and that all test activities are completed before the code moves to the next stage.
The DoR acts as a pre-flight checklist, preventing QA from encountering avoidable setup issues, while the DoD serves as an exit checklist, guaranteeing that no validation steps were missed. This structured approach creates a predictable, transparent workflow, reduces the feedback loop for environment-related bugs, and builds confidence in the testing process. It is a fundamental component of mature test environment management best practices that bridges the gap between environment provisioning and test execution.
Why It's a Top Priority
Without explicit DoR/DoD criteria, teams operate on assumptions. Developers might assume the environment is ready when it isn't, and QA might push code forward based on an incomplete test run. This ambiguity leads to failed tests, rework, and schedule delays. Formalizing these entry and exit criteria transforms the handoff process from a vague "it's ready" into a verifiable, data-driven event.
Platform engineering teams at companies like Google Cloud have institutionalized this by implementing automated validation of DoR criteria before a test suite is even allowed to execute. Similarly, Amazon enforces a multi-stage DoD across its dev, staging, and production environments, ensuring code meets stringent quality, performance, and security bars at each step before promotion. This discipline is key to managing complexity at scale.
Actionable Implementation Tips
Implementing DoR and DoD for environments requires collaboration between development, QA, and operations. Here’s how to put it into practice:
Define Criteria Collaboratively: Host a meeting with Dev, QA, and DevOps to create specific, measurable checklists for DoR and DoD. Store these checklists in a shared Confluence or Notion page so everyone has access.
Establish a "Ready" Checklist (DoR): Your Definition of Ready checklist should include actionable items: all services return 200 OK from their /health endpoint, the correct application version is deployed (verify via an /info endpoint), and required test data is seeded.
Establish a "Done" Checklist (DoD): Your Definition of Done checklist should confirm: 100% of automated E2E tests passed, performance test results are within 2% of the baseline, SonarQube security scan passed with zero critical vulnerabilities, and all test results are logged in TestRail.
Automate Gate Checks: Integrate these checks directly into your CI/CD pipeline. For example, add a script that polls the /health endpoints and fails the pipeline if any service is unhealthy (DoR). Add a quality gate that checks the SonarQube API for scan results before allowing a merge to the main branch (DoD).
Visualize Status: Create a status page or a dashboard that displays the DoR/DoD checklist for each active test environment. This provides a clear, real-time signal to the entire team about an environment's readiness for the next stage. For an in-depth guide on structuring these processes, you can learn more about Jira workflow best practices.
6. Automated Environment Teardown and Cost Optimization
Ephemeral, on-demand test environments are a powerful asset, but they can quickly become a significant financial drain if left running indefinitely. Automated environment teardown is the practice of systematically and automatically de-provisioning test environments once they are no longer needed. This discipline is a critical component of modern test environment management best practices, directly combating resource waste and controlling cloud expenditure.
This process involves establishing policies and automation scripts that clean up resources after a test run is complete, a feature branch is merged, or a predefined time-to-live (TTL) expires. By implementing automated cleanup, you prevent the accumulation of "zombie" environments that consume valuable compute, storage, and network resources without providing any value. This not only optimizes costs but also ensures a clean slate for future tests, preventing configuration drift and issues caused by lingering, stale environments.
Why It's a Top Priority
In the pay-as-you-go cloud model, every idle resource translates directly to unnecessary spending. Without automated teardown, cloud bills can spiral out of control, and teams may become hesitant to spin up new environments for fear of the associated cost. This creates a bottleneck that stifles innovation and slows down testing cycles. Effective cost optimization ensures that engineering teams can leverage the full power of dynamic environments without financial repercussions.
This practice is standard at hyperscale companies where infrastructure costs are a primary concern. For example, Uber implements aggressive automated cleanup policies to manage its vast microservices testing infrastructure, minimizing cloud waste. Similarly, AWS itself promotes the use of lifecycle policies and tags to automatically terminate or stop test instances after a set duration, a best practice adopted by countless organizations on its platform.
Actionable Implementation Tips
A proactive approach to cleanup and cost control is essential. Here’s how to put it into practice:
Implement Time-Based Expiration Tags: When provisioning resources with Terraform or CloudFormation, automatically apply a tag like destroy-after: 2024-10-28T18:00:00Z. Then, run a scheduled nightly script (e.g., a Lambda function) that scans for resources with this tag and de-provisions any that have passed their expiration date.
Integrate Cleanup into CI/CD Pipelines: In your CI/CD tool, configure a job that triggers on pull request merge or close events. This job's sole purpose is to execute the terraform destroy command for the associated environment, ensuring no resources are left behind.
Set Up Budget Alerts and Quotas: Go to your cloud provider's billing console (AWS Cost Explorer or Azure Cost Management) and create a budget for your testing environments. Configure an alert to send a notification to a Slack channel when spending reaches 80% of the budget.
Leverage Spot Instances: For non-critical, interruptible workloads like performance or load testing, modify your IaC scripts to use cloud providers' spot instances instead of on-demand ones. This can reduce compute costs by up to 90%.
7. Environment Versioning and Configuration Control
Just as application code evolves, so do the environments that host it. Treating environment configurations as an afterthought is a recipe for untraceable errors and painful rollbacks. The solution is to apply the same rigor to your infrastructure as you do to your source code. Environment versioning means managing all configuration files under a strict version control system, like Git, creating an immutable, auditable history of every change.
This practice transforms your infrastructure from a fragile, manually-configured entity into a predictable and reproducible asset. It allows teams to pinpoint exactly when a change was made, who made it, and why. By versioning configurations, you can easily compare differences between environments, roll back to a previously known good state, and coordinate complex infrastructure changes across multiple teams with confidence. This approach is fundamental to modern test environment management best practices, providing the accountability needed to maintain stable and reliable systems.
Why It's a Top Priority
Without version control, your environment's state is ephemeral and undocumented. A manual change made to fix a "quick issue" can introduce subtle regressions that are nearly impossible to debug later. Versioning your environment configurations provides a single source of truth and an explicit audit trail. This transparency is crucial for security, compliance, and operational stability, as it ensures that every modification is deliberate, reviewed, and documented.
This principle is a core tenet of the Infrastructure as Code (IaC) movement. For instance, GitHub manages its own vast infrastructure by storing all environment definitions in Git repositories, enabling a full version history and peer-reviewed change process. Similarly, teams at Shopify and Slack version-control their Kubernetes manifests alongside application code, ensuring infrastructure and application deployments are always synchronized.
Actionable Implementation Tips
Adopting a version-controlled approach to environment management requires a combination of tools and disciplined processes. Here’s how to get started:
Centralize Configurations in Git: Create a dedicated Git repository for all infrastructure code, including Terraform scripts, Ansible playbooks, and Kubernetes manifests. This repository becomes your infrastructure's single source of truth.
Embrace Infrastructure as Code (IaC): Use tools like Terraform, AWS CloudFormation, or Helm to define every component of your environment in code. Avoid manual changes in the cloud console; all modifications must be made through code.
Enforce Pull Request (PR) Workflows: Configure your Git repository to require pull requests for all changes to the main branch. Mandate that at least one other team member must review and approve the PR before it can be merged. This ensures peer review and prevents unauthorized changes.
Tag and Align Versions: When you release a new version of your application, also create a corresponding Git tag for your infrastructure configuration (e.g., infra-v1.2.0 aligns with app-v1.2.0). This makes it simple to roll back both application and infrastructure together if an issue occurs.
Keep Secrets Separate: Never commit secrets (API keys, passwords) into your Git repository. Use a secrets management tool like HashiCorp Vault or AWS Secrets Manager. Your IaC code should reference these secrets by name, and the CI/CD pipeline will inject the actual values at runtime.
8. Cross-Team Handoff Automation and Notifications
The transition of a software build from a development environment to QA, then to staging, and finally to production is a critical process often plagued by manual errors and communication delays. A manual handoff relies on emails, chat messages, or verbal updates, creating opportunities for missed steps, forgotten artifacts, and idle time as teams wait for notifications. Automated handoff workflows are a core component of modern test environment management best practices that solve this problem directly.
By automating these transitions, you create a structured, repeatable, and transparent process. When a developer marks a feature as "ready for QA," an automation rule can trigger a series of actions: verifying that all prerequisites are met, deploying the build to the QA environment, reassigning the task to the QA team, and sending an instant notification with all relevant context. This eliminates the "over-the-wall" mentality, reduces coordination overhead, and significantly shortens the feedback loop.
Why It's a Top Priority
Automated handoffs are crucial for maintaining momentum in a continuous delivery pipeline. Delays between stages are a common source of waste, directly impacting time-to-market. When a QA engineer has to manually check if a new build is deployed or chase a developer for test notes, valuable testing time is lost. This manual friction compounds in complex workflows involving multiple teams and environments, leading to release bottlenecks.
Leading tech and regulated companies have mastered this to accelerate delivery. Microsoft, for its Azure services, uses highly structured, automated handoff processes to manage deployments across globally distributed teams and complex infrastructure. Similarly, financial services firms integrate automated handoffs with regulatory approval gates, ensuring compliance is built into the workflow, not an afterthought.
Actionable Implementation Tips
Implementing a robust handoff system requires a clear map of your delivery process and the right tools to orchestrate it.
Map All Environment Transitions: Use a tool like Miro or Lucidchart to visually map every handoff point in your delivery pipeline (e.g., Dev → QA, QA → Staging). For each transition, clearly define the entry and exit criteria.
Define Required Artifacts: For each handoff, create an explicit checklist of required artifacts. For example, the handoff to QA might require links to unit test results, a code coverage report, and the passing SonarQube scan. Use automation to block transitions if these are missing.
Use Contextual, Instant Notifications: Configure your workflow automation tool (e.g., Jira Automation, GitHub Actions) to send an immediate alert to a specific Slack or Microsoft Teams channel. The notification should include a direct link to the Jira ticket, the build number, and a summary of what needs to be done.
Integrate Environment Health Checks: As the very first step in a handoff automation, add a script that calls the /health endpoint of the target environment (e.g., the QA environment). If the environment is unhealthy, the automation should fail immediately and notify the operations team, preventing a failed deployment. For a deeper dive into structuring these workflows, you can learn more about Jira workflow automation on harmonizepro.com.
8-Point Test Environment Management Comparison
Item
Implementation Complexity 🔄
Resource Requirements ⚡
Expected Outcomes 📊
Ideal Use Cases 💡
Key Advantages ⭐
Environment Parity and Configuration Management
Medium — requires IaC, containers and discipline
Moderate — infra, tooling (Terraform/Ansible), ops time
Consistent test behavior; fewer "works on my machine" issues
Multi-stage pipelines (dev→staging→prod); onboarding new engineers
Reproducible environments; easier troubleshooting
Automated Test Environment Provisioning
High — IaC + CI/CD integration and orchestration
High — compute, IaC expertise, CI runners
Fast, on-demand, isolated test runs; parallelization
Per-PR testing, large test suites, CI-driven workflows
Eliminates manual setup; speeds feedback loops
Test Data Management and Isolation
High — data masking, seeding, lifecycle automation
Moderate–High — DB tooling, storage, compliance controls
Repeatable, isolated tests; reduced flakiness and data leaks
E2E/regression tests; systems with sensitive data (PII/PCI)
Ensures data privacy; improves test reliability
Environment Monitoring and Health Checks
Medium — dashboarding, alerts and log aggregation
Moderate — monitoring platforms, metric storage
Early detection of drift/issues; reduced false negatives
Long-lived test envs; performance-sensitive applications
Eliminates manual coordination; improves visibility and compliance
From Best Practices to Business Impact
Navigating the complexities of modern software development requires more than just skilled engineers and innovative ideas; it demands a robust, reliable, and efficient pipeline from code commit to customer value. As we've explored, the often-overlooked discipline of test environment management is the linchpin that holds this entire process together. Adopting these test environment management best practices is not merely an IT housekeeping task; it's a fundamental strategic shift that directly impacts your organization's velocity, quality, and bottom line.
By moving from chaotic, manual processes to a structured, automated framework, you transform your testing infrastructure from a constant source of friction into a powerful competitive advantage. The journey from bottleneck to accelerator begins with the principles we've detailed: achieving environment parity, automating provisioning and teardown, mastering test data, and implementing rigorous monitoring. These practices collectively dismantle the silos and guesswork that plague so many development cycles.
Synthesizing the Strategy: Your Actionable Takeaways
Mastering this domain is a journey, not a destination. The key is to start small and build momentum. Instead of attempting a complete overhaul overnight, focus on incremental improvements that deliver immediate value and build a foundation for future enhancements.
Here are the most critical takeaways to begin your transformation:
Automation is Non-Negotiable: The single most impactful change you can make is to automate repetitive tasks. Start with environment provisioning using tools like Terraform or Ansible. Once that’s established, automate health checks, and finally, automate the teardown process to reclaim resources and control costs. Automation is your primary weapon against inconsistency and human error.
Treat Environments as Code (EaC): The principle of version-controlling your environment configurations, just as you do your application code, is paramount. This practice is the bedrock of achieving true environment parity, ensuring that what you test is an exact replica of what you deploy. It eliminates the "it worked on my machine" class of bugs and drastically reduces release-day surprises.
Clarity and Communication are Essential: Formalize your processes with clear definitions. A "Definition of Ready" for an environment entering QA and a "Definition of Done" for handoffs create unambiguous quality gates. Integrating automated notifications into your CI/CD pipeline and communication tools like Slack ensures that every stakeholder has real-time visibility, preventing delays caused by miscommunication.
Data Management is a First-Class Citizen: Ineffective test data management can invalidate your entire testing effort. Prioritize creating a strategy for generating realistic, anonymized, and isolated datasets. This not only improves the accuracy of your tests but also ensures compliance with privacy regulations like GDPR and CCPA, protecting your organization from significant risk.
From Practice to Profit: The Broader Business Impact
Implementing these test environment management best practices creates a ripple effect across the entire organization. Developers spend less time fighting fires and more time innovating. QA teams can execute tests with higher confidence and speed. Release managers can orchestrate deployments with predictable, repeatable outcomes.
Ultimately, this operational excellence translates directly into tangible business value:
Faster Time-to-Market: A streamlined environment pipeline removes bottlenecks, allowing you to ship features and bug fixes to your customers more quickly.
Improved Product Quality: Consistent, reliable test environments lead to more thorough testing, catching bugs earlier in the cycle when they are cheaper and easier to fix.
Reduced Operational Costs: Automation, especially in environment teardown and resource optimization, directly cuts down on infrastructure spending.
Enhanced Team Morale: By eliminating frustrating, repetitive manual work and empowering teams with self-service capabilities, you create a more productive and satisfying work environment.
The path forward is clear. Begin by auditing your current processes, identify the most significant pain point, and apply one of the practices discussed. Whether it's version-controlling a single environment's configuration or automating one health check, each step forward builds a more resilient and agile delivery ecosystem.
Ready to turn these best practices into an automated, self-managing system? Harmonize Pro's Nesty for Jira orchestrates your entire environment management workflow directly within Jira, enforcing quality gates and automating handoffs. See how you can build a world-class testing infrastructure by visiting us at Harmonize Pro.
Software deployment best practices are the set of rules that separate high-performing teams from the rest. They transform risky, all-night release marathons into a smooth, automated, and repeatable process. The goal is simple: make every deployment a non-event.
This guide provides an actionable blueprint for achieving that. We'll focus on the practical steps to automate builds and tests, maintain perfectly consistent environments, and leverage smart rollout strategies to deliver value to users faster and without the drama.
The Blueprint for Flawless Software Deployment
Forget the "big bang" releases of the past. Modern software deployment is about a continuous stream of small, low-risk changes delivered through a robust pipeline. This pipeline is your automated assembly line for code, moving it from a developer's commit to production with automated quality gates at every stage.
To build this system, you need to implement a set of core principles. Here’s what you need to focus on.
Key Software Deployment Best Practices at a Glance
This table provides a quick, scannable summary of the core actions you need to take for reliable software deployments.
Best Practice
Your Actionable Task
Primary Benefit
Automation
Script every step: builds, tests, environment setup, and deployments.
Eliminates human error, accelerates delivery, and frees up engineers.
CI/CD
Set up a pipeline that automatically builds and tests every commit.
Catches bugs in minutes, not weeks, enabling smaller, faster releases.
Consistent Environments
Use Infrastructure as Code (IaC) to define all environments (dev, stage, prod).
Eradicates "it works on my machine" issues for predictable deployments.
Observability
Implement tools for centralized logging, metrics, and tracing in production.
Provides immediate insight into application health and user impact.
Rollback Strategy
Document and test a one-click or single-command rollback procedure.
Minimizes downtime and turns potential disasters into minor hiccups.
Security baked in
Add automated security scans (SAST/DAST) as mandatory steps in your pipeline.
Finds and fixes vulnerabilities before they ever reach production.
Implementing these practices isn't about adding bureaucracy; it's about building a system that makes doing the right thing the easiest thing.
From Chaos to Control
Transforming your deployment process from a source of anxiety into a competitive advantage requires a shift in mindset and tooling. Here are the actionable principles to guide you:
Automate First: Identify every manual step in your current process. Prioritize automating the most repetitive and error-prone tasks first.
Consistency is Key: Use tools like Docker and Terraform to define your environments in code. This makes them perfectly reproducible and eliminates configuration drift.
Plan for Failure: Your deployment is not complete until you have a tested rollback plan. Run regular fire drills to ensure you can revert a failed deployment instantly.
Centralized Orchestration: Use a tool like Jira as your command center. Configure it to track the status of deployments, manage approvals, and automate handoffs between your pipeline and your team.
A mature deployment pipeline doesn't just move code; it enforces quality. Implement automated checks at each stage to create a system where developers can release with confidence.
Why Jira Is Your Command Center
Throughout this guide, we'll show you how to use Jira as the operational hub for your deployment pipeline. It’s where you can track work, manage approvals, and trigger automated workflows.
Here’s a practical example: a developer merges code, triggering a webhook that starts a build. Once the build passes tests and deploys to staging, the pipeline sends a signal back to Jira. The ticket automatically transitions to "Ready for QA" and is assigned to the correct tester. This eliminates manual updates and ensures the process keeps moving.
Automating Your Path to Production with CI/CD
If your deployment process is an assembly line, Continuous Integration and Continuous Deployment (CI/CD) is the robotics system that makes it run. It replaces slow, manual handoffs with a fast, reliable, and automated workflow. This is the engine that drives modern software delivery.
The principle is simple: integrate small code changes frequently and deploy them continuously. Continuous Integration (CI) automatically builds and tests every code change, catching bugs immediately. Continuous Deployment (CD) then automatically releases every change that passes all tests directly to production. This feedback loop is a game-changer, cutting the cost and effort of fixing bugs by finding them in minutes instead of weeks.
The CI/CD Assembly Line in Action
Your CI/CD pipeline acts as a series of automated quality gates. Here is the step-by-step flow you should implement:
Commit Stage: A developer pushes code to a Git repository. This action is the trigger for the entire pipeline.
Build Stage: A CI tool like Jenkins, GitLab CI, or CircleCI detects the change, pulls the code, and compiles it. If the build fails, the pipeline stops and notifies the developer immediately.
Test Stage: The compiled code is subjected to a suite of automated tests. Start with unit tests for individual functions and then run integration tests to ensure all components work together correctly. A failed test must stop the deployment.
Deploy Stage: Once all tests pass, the CD portion of the pipeline deploys the code to a staging environment for final validation before being pushed to production.
This automated sequence ensures every line of code is rigorously vetted before a customer sees it, making your deployments faster and safer.
The Power of Automation at Scale
Teams that fully implement CI/CD operate at a different level. According to DevOps Research and Assessment (DORA) metrics, elite teams deliver software 2.5 times faster than their peers. Companies like Netflix and Amazon deploy thousands of times per day, making releases a routine business operation. You can explore more of these powerful DevOps statistics and their impact on mend.io.
CI/CD isn't just about speed; it's about building confidence. Create a robust safety net of automated tests so your team can release updates knowing that errors will be caught long before they become customer-facing problems.
Jira as Your CI/CD Control Tower
While your CI/CD tools handle the technical execution, use Jira to orchestrate the overall workflow. Connect your pipeline to your project management process for end-to-end visibility.
For example, configure a webhook from your CI tool to update a Jira ticket automatically. When a build deploys to staging, the Jira status should flip from "In Progress" to "Ready for QA," and the ticket should be assigned to the test lead. This eliminates communication gaps. To learn how to connect different tools and automate these sequences, investigate how process orchestration connects tools and automates complex sequences. This creates a single source of truth where anyone can see the exact status of a feature at a glance.
Choosing Your Deployment Strategy to Minimize Risk
With a CI/CD pipeline in place, your next decision is how to release new code to users. Choosing the right deployment strategy is about controlling the "blast radius"—limiting the impact if something goes wrong. This is not a one-size-fits-all decision; you must select the strategy that best matches your application's risk profile.
Here are the most effective strategies teams use to de-risk their releases.
Canary Deployments: Testing the Waters
A canary deployment is your early warning system. Instead of releasing a new version to all users at once, you roll it out to a small subset, like 1% of your traffic.
Monitor this group closely. Track key metrics like error rates, latency, and user engagement. If the metrics remain healthy, gradually increase the traffic to the new version—from 1% to 10%, then 50%, and finally 100%. If you detect any issues, you can instantly roll back by routing all traffic back to the old, stable version. This turns a high-stakes release into a controlled, data-driven experiment.
Blue-Green Deployments: A Seamless Switch
A blue-green deployment requires two identical production environments: "Blue" (the current live version) and "Green" (the new version).
First, deploy the new version to the idle Green environment. Here, you can run a final round of tests against a production-like setup without affecting any users. Once you have full confidence, you update your router or load balancer to redirect all traffic from Blue to Green.
The switch is instantaneous, resulting in zero downtime for users. The old Blue environment remains on standby, ready for an immediate rollback if any problems arise in the Green environment.
Rolling Deployments: A Gradual Update
With a rolling deployment, you update application instances incrementally, one by one or in small batches. For example, if your application runs on ten servers, you update server one, verify it passes health checks, and then proceed to server two.
This method avoids downtime since healthy instances are always available to serve traffic. It is generally simpler to implement than blue-green, but it introduces a brief period where both old and new versions run simultaneously, which can create compatibility challenges if not managed carefully.
This diagram highlights the core message: manual processes lead to errors, while an automated pipeline is the foundation for successful, reliable deployments.
Automation is the non-negotiable prerequisite for predictable and repeatable releases.
How to Choose the Right Strategy
Your choice of strategy depends on your application's architecture and your team's tolerance for risk. For critical applications, start with a canary release that routes just 1-5% of traffic to the new version. This allows you to validate performance with real users before committing to a full rollout. DevOps teams that adopt these practices deploy 46 times more often and resolve incidents 96 times faster. You can find more practical advice in these software deployment best practices on 42coffeecups.com.
Use this table to guide your decision:
Strategy
Actionable Use Case
Key Consideration
Canary
Use for high-traffic applications where you need to validate performance with a small percentage of real users.
Requires robust monitoring and traffic-shaping capabilities.
Blue-Green
Use for mission-critical services where zero downtime is mandatory and you need to test in a production twin.
Requires maintaining double the infrastructure, which can increase costs.
Rolling
Use for simpler applications or monoliths where brief periods of mixed versions are acceptable.
Rollbacks can be more complex than a simple traffic switch.
The best strategy is the one that allows your team to deliver value to users confidently and with minimal drama.
Building Reliable Environments with Infrastructure as Code
The "it works on my machine" problem is a notorious time-waster caused by inconsistencies between development, staging, and production environments. The solution is Infrastructure as Code (IaC).
IaC is the practice of defining your entire infrastructure—servers, databases, load balancers, and networks—in version-controlled text files. Instead of manually configuring resources, you write a script that can build a perfectly identical environment every time. This script becomes your single source of truth, reviewed and tested just like your application code. It ensures your development, staging, and production environments are not just similar—they are identical.
Eliminating "Configuration Drift" for Good
Configuration drift occurs when manual, ad-hoc changes cause an environment to deviate from its intended state over time. These small tweaks accumulate, making the environment fragile and impossible to replicate.
IaC eliminates drift by enforcing that all changes are made through code. To modify the infrastructure, you update the IaC script, get it peer-reviewed, and apply it automatically. This makes your environments disposable. If you encounter an issue, don't waste time debugging a live server; simply destroy it and provision a fresh, perfect copy from your code in minutes.
Adopt Infrastructure as Code to transform infrastructure management from a manual, error-prone task into a predictable, automated engineering discipline. This is your guarantee that what you test is exactly what you deploy.
Popular IaC Tools and Getting Started
To get started with IaC, choose a tool that fits your team's stack and expertise. Here are the most popular options:
Terraform: An open-source tool from HashiCorp that is cloud-agnostic. Use it to manage infrastructure across AWS, Azure, and Google Cloud with a single declarative language.
AWS CloudFormation: The native IaC solution for AWS. Define your resources in YAML or JSON templates and let AWS handle the provisioning.
Ansible: A configuration management tool from Ansible that can also provision infrastructure. It is known for its simple, agentless architecture and human-readable YAML syntax.
Pulumi: Define infrastructure using general-purpose programming languages like Python, TypeScript, or Go. This is a great choice for teams that want to use familiar tools.
To adopt IaC, start small. Select one component of your system, like a staging database, and define it using an IaC tool. Commit the code to version control and practice destroying and recreating it. This small win will demonstrate the power of the approach and build momentum.
The Strategic Impact of IaC
Adopting IaC is a significant step in maturing your deployment practices. By treating infrastructure like software, you make it version-controlled, automated, and reproducible. This is a critical enabler for CI/CD, as it drastically reduces the time needed to set up environments and guarantees consistency across your entire pipeline. The data shows that 78% of organizations have already adopted DevOps practices, and over 85% rely on cloud strategies where IaC is essential for scaling. You can learn more about how IaC is shaping modern deployments at configu.com.
Implementing Quality Gates and Rollback Plans
A fast deployment process is useless if it delivers broken code. To ensure stability, you must implement two critical safety nets: quality gates and rollback plans.
A quality gate is a mandatory checkpoint in your deployment pipeline. It is a hard stop where specific, predefined criteria must be met before code can advance to the next stage. These are the non-negotiable rules that protect your production environment.
What Makes a Strong Quality Gate
Effective quality gates are automated and uncompromising. They are the guardians that prevent buggy code from reaching users. Implement these checks in your pipeline:
Automated Test Success: Require 100% pass rates for all unit, integration, and end-to-end tests. No exceptions.
Code Quality Scans: Integrate static analysis tools to check for code complexity, duplication, and adherence to style guides. Fail the build if standards are not met.
Security Vulnerability Scans: Use automated security tools (SAST/DAST) to scan for known vulnerabilities in your code and its dependencies. Block any release that introduces a critical security flaw.
Performance Thresholds: Run automated performance tests to ensure the new code does not degrade response times or increase resource consumption beyond acceptable limits.
Manual Approvals: For critical releases, configure your pipeline to require a manual sign-off from a QA lead or product manager directly within a tool like Jira.
By automating these checkpoints, you codify your Definition of Done directly into your pipeline, ensuring every release meets the same high standard.
Planning for Failure with Rollback Strategies
Despite your best efforts, failures in production will happen. When they do, you need a reliable "undo" button. This is your rollback plan.
A rollback plan is your acknowledgment that perfection is unattainable and your commitment to minimizing impact when issues arise. A tested rollback strategy is what turns a potential catastrophe into a minor, quickly resolved incident.
Every deployment must have a clear, documented, and regularly tested procedure for reverting to the last known good state. Without one, you are simply hoping for the best—a failed strategy in software engineering.
Automated Versus Manual Rollbacks
Your rollback procedure should be as fast and safe as possible. Here are the two primary approaches:
Rollback Type
Description
Actionable Advice
Automated
The CI/CD pipeline or a monitoring tool detects a critical failure (e.g., a spike in 500 errors) and automatically triggers a revert to the previous version.
Implement this for Blue-Green or Canary deployments where a rollback is a simple traffic switch. Configure alerts to trigger the rollback automatically.
Manual
An on-call engineer follows a documented checklist to redeploy the previous stable version of the application.
Use this for complex systems or database migrations. The checklist must be clear, concise, and tested regularly in a staging environment.
The most critical action is to test your rollback procedure regularly. Run fire drills in a non-production environment to ensure the process works and your team knows exactly what to do. To streamline these approval and reversal steps, explore guides on what workflow automation is and how it can help to build more resilient processes.
Putting It All Together: A Practical Jira Workflow for Software Deployment
All these best practices come together in your daily workflow, and for most teams, the hub of that workflow is a Jira ticket. A well-configured Jira workflow transforms a simple task into a command center for your entire deployment process, making best practices a concrete and repeatable reality.
Here is a step-by-step walkthrough of an automated, quality-driven deployment workflow managed in Jira.
From Development to Staging
The process starts when a developer moves a ticket to "In Progress" and creates a feature branch. When they push their first commit, automation kicks in:
Your CI/CD pipeline is triggered instantly. It builds the code and runs all unit and integration tests. If any test fails, the pipeline stops and notifies the developer immediately, creating a tight feedback loop.
Once all tests pass, the pipeline automatically deploys the feature to the staging environment. This triggers another automated action.
Configure your CI tool to call the Jira API. The Jira ticket's status automatically changes from "In Progress" to "Ready for QA," and the ticket is assigned to the QA lead. This handoff happens without any manual intervention.
The QA Approval Quality Gate
Now the ticket is with the QA team, representing a critical quality gate. The QA engineer tests the feature in the staging environment, which is an identical clone of production thanks to Infrastructure as Code.
The goal is to formally validate that the software is stable, meets all acceptance criteria listed in the Jira ticket, and is secure. To enforce this, build mandatory checks directly into your Jira workflow. For example, use an app like Harmonize Pro to add a structured checklist that must be completed before the ticket can be advanced.
This makes your Definition of Done explicit and impossible to bypass. The ticket cannot move forward until every quality check is verified.
Deploying to Production and Closing the Loop
Once QA completes the final checklist item, another automation rule fires, preparing the ticket for its final journey to production.
Approval for Production: The ticket transitions to "Ready for Release." This can trigger a notification to a product manager or release manager for final business-level approval.
Production Deployment: With the final green light, the release engineer triggers the production deployment, using a Canary or Blue-Green strategy to ensure a safe rollout.
Post-Deployment Monitoring: After deployment, the ticket moves to a "Monitoring" status while the team watches performance dashboards and logs to confirm stability.
Done: Once the release is stable in production, the ticket is moved to "Done."
The entire history of the deployment—from the first commit to the final release, including all automated checks and manual approvals—is now captured in a single Jira ticket. This is the power of effective Jira workflow automation: it connects your tools and teams into one unified, reliable system.
Common Questions About Software Deployment
Here are answers to common questions that arise as teams work to improve their deployment processes.
What's the Single Most Important Practice for a Small Team?
For a small team, the highest-impact action you can take is to set up a basic CI/CD pipeline.
Automating your build and test process provides the biggest return on investment. It saves time, reduces human error, and creates a solid foundation that you can build upon as your team grows. Start here.
How Should We Handle Database Migrations?
Treat database migrations as first-class citizens of your deployment process, not afterthoughts.
Follow these practical steps:
Version control everything. Store all migration scripts in your Git repository alongside your application code.
Design for failure. Write backward-compatible migrations. This ensures you can roll back your application code without breaking the database.
Test rigorously. Execute and validate every migration in a staging environment that is an exact replica of production before deploying.
What’s the Real Difference Between Continuous Delivery and Continuous Deployment?
The difference comes down to one final, manual approval step.
Continuous Delivery means every change that passes all automated tests is automatically deployed to a production-like environment. A human must then manually trigger the final release to production.
Continuous Deployment removes the manual step. If a change passes all automated gates, it is automatically released all the way to production without human intervention.
Think of it this way: Continuous Delivery gets the release ready to go, but you still have to press the button. Continuous Deployment presses the button for you.
Turn your software deployment best practices into automated, enforceable workflows with Harmonize Pro. See how our Jira app Nesty can build quality gates and automate handoffs to ensure flawless deployments every time. Learn more and get started.
If you're still relying on spreadsheets and endless status meetings for your Jira software release management, you're creating unnecessary friction. This manual approach is a surefire way to introduce communication silos and human error, turning what should be a smooth process into a chaotic firefight. Let's fix that.
Moving Beyond Spreadsheets And Status Meetings
For any modern software team, traditional release management is fundamentally broken. The problem isn't just that it's slow; it's the daily productivity loss that occurs when your release process lives outside of Jira, your team's central hub for development.
When teams track progress across a patchwork of different tools, the result is predictable chaos. Ditch these common pain points by centralizing your process in Jira:
Eliminate Status Meetings: Replace meetings where people report progress with real-time Jira dashboards. Progress should be visible to everyone, at all times, without a meeting.
Kill the "Master" Spreadsheet: A release tracker spreadsheet is a single point of failure. It’s instantly out of date and creates version control nightmares. Use Jira Versions as your single source of truth.
Reduce Communication Noise: Without a central hub, your team is stuck in a loop of Slack messages and emails just to clarify status. A well-configured Jira project makes the status clear to everyone.
The Real Cost Of Manual Tracking
Manual coordination is incredibly risky. One missed update in a spreadsheet can lead to deploying the wrong code, skipping a crucial testing step, or giving stakeholders an inaccurate timeline. The result? Delayed launches and a frustrated team spending more time on admin than building software.
Take Swiss Re, a global reinsurance company that had to manage releases across 12 interconnected applications. They were buried in spreadsheets, leading to constant emails and calls for basic updates. By bringing their release management directly into Jira, they cut communication overhead by 50%. This freed up their teams to focus on shipping, not chasing information. You can read more about Swiss Re's successful transition and replicate their success.
The core problem with manual release management is the lack of a single source of truth. When development is in Jira but release coordination is elsewhere, you guarantee misalignment.
A structured, automated approach built inside Jira isn't just a "nice-to-have." It’s essential for shipping software reliably and efficiently.
Laying the Foundation for Your Jira Release Workflow
Before building complex automations, get the fundamentals right. A successful Jira software release management process is built on a solid foundation using Jira’s native features. This creates a single source of truth for every release, eliminating scattered spreadsheets for good.
The cornerstone of this setup is the Jira Version. Treat a Version as a container that holds every piece of work (features, bug fixes, tech debt) destined for a specific deployment. Proper configuration is non-negotiable for a predictable release cadence.
Taming Your Releases With Jira Versions
First, create a Version for your upcoming release. Navigate to your Jira project settings, find the 'Releases' section, and create a new version.
Give it a descriptive name like "Q3-Mobile-App-V2.1" instead of a generic one like "Next Release." Most importantly, set a Start date and a Release date. These dates are what Jira uses to measure progress against your timeline.
With the Version created, start assigning issues to it using the Fix Version/s field during backlog grooming or sprint planning. Every issue you tag gets added to that release container, making the scope visible and trackable for everyone.
Getting Your Workflow to Mirror Reality
Your Jira workflow must be an accurate model of your actual release process. For Jira's reporting to be useful, your final workflow column—typically 'Done'—must represent work that is truly finished and ready to ship.
Here's a critical step: map your final status to the correct category. Jira’s release reports only count an issue as "done" if its status is mapped to the green 'Done' status category. If your final step is called "Shipped" but isn't mapped to that green category, Jira won't see it as completed. Your burndown charts will be inaccurate. For a step-by-step walkthrough, our guide on https://harmonizepro.com/blog/changing-workflow-in-jira provides the specifics.
A common mistake is a "Testing Complete" status that isn't mapped to the 'Done' category. All those validated issues will still show up as unresolved in your release view, causing unnecessary panic.
Every release in Jira combines scope (issues), a timeline (dates), and its journey through your workflow. With agile adoption now exceeding 70% in enterprises, this kind of tracking is crucial for cutting project delays.
The Essential Jira Release Management Components
To tie this all together, master these native Jira components. This is your foundational toolkit.
Key Jira Components For Release Management
Jira Component
Primary Function
Actionable Tip
Versions (Releases)
Acts as a container to bundle all issues (features, bugs, tasks) for a specific deployment.
Use a consistent naming convention (e.g., "Platform-V4.2-Q3") and always set a start and release date.
Fix Version/s Field
The Jira field that links an individual issue to one or more release Versions.
Make updating this field a required part of your backlog grooming or sprint planning process.
Workflow Statuses
Visual representation of the steps your work goes through from "To Do" to "Done."
Customize your workflow to match how your team actually works, not just a generic template.
Status Categories
The backend mapping that tells Jira whether a status means "To Do," "In Progress," or "Done."
Double-check that all of your final statuses (e.g., "Deployed," "Live") are mapped to the green 'Done' category.
Release Burndown Chart
A real-time report that visualizes remaining work against the time left before the release date.
Check this chart daily. It's your early warning system for scope creep and potential delays.
Mastering these components gives you the control and visibility to run a smooth release process directly within Jira.
Putting the Release Burndown Chart to Work
Once your Versions and workflow are configured correctly, leverage Jira's most powerful native tool: the Release Burndown chart. This isn't just another report; it’s your command center for tracking release health.
Use this chart to get immediate answers without pinging developers:
Is scope creeping? A sharp upward jump in the "Total issues" line means new work has been added.
What's our velocity? The downward slope of the "Remaining issues" line shows your team's completion rate. A flat line is a red flag.
Are we on track? If the projected burndown trend extends past your release date, you have an early warning that you're at risk.
This is actionable intelligence. Use this real-time visibility to make proactive decisions—adjust scope, reallocate resources, or manage stakeholder expectations—long before the deadline.
Building Reliable Quality Gates And Handoffs
With a solid workflow in place, it's time to build the automated checkpoints that elevate your Jira software release management. Go beyond simple status tracking by creating automated quality gates and handoffs. These are the tools that prevent bad code from slipping through and eliminate the endless "is this ready yet?" conversations.
A workflow status is just a label. A quality gate is a barrier that lowers only when specific criteria are met. Without this, you’re relying on trust and memory, which are unreliable under pressure.
We've all seen a developer drag a ticket to "Ready for QA" when the feature branch isn't merged and no test notes exist. The QA engineer wastes time playing detective and bounces the ticket back. This is the inefficiency that enforceable quality gates are designed to prevent.
Enforcing Your Definition Of Done With Blockers
Your Definition of Done (DoD) needs to be more than a wiki page; it must be an active part of your Jira workflow. The most effective way to achieve this is by embedding detailed checklists directly inside your Jira issues and using them to block transitions.
For example, a developer's DoD before a QA handoff should include:
Code Review Completed: All PR feedback is addressed and approved.
Unit Tests Passed: The new code is covered, and the test suite is green.
Feature Branch Merged: The code is in the main development branch.
Deployed to Staging: The build is live on the staging environment.
Using an app like Nesty, you can build this checklist into your Jira issue templates. Then, configure the workflow so the "Move to QA" transition is physically blocked until every item is checked. It's not a suggestion; it's a hard requirement. The developer simply cannot pass the ticket on until the work is verifiably done.
This mechanism shifts accountability from the QA engineer back to the developer. When a ticket lands in the QA queue, the team knows it’s genuinely ready. This action alone can slash QA cycle times and reduce back-and-forth communication.
Your DoD becomes an active contract within each ticket, creating a clear, auditable trail.
Automating The Perfect Handoff
Once the "is it ready?" problem is solved, tackle the handoff itself. Manual handoffs are notoriously error-prone. Automate the process to ensure nothing gets missed.
Here is an actionable "Dev → QA" handoff automation, triggered the instant a developer completes their DoD checklist:
The Trigger: The final item on the "Developer DoD" checklist is marked complete.
The Automated Actions:
Status Transition: The issue instantly moves from "In Progress" to "Ready for QA." No manual board updates are needed.
Assignee Change: The ticket is unassigned from the developer and reassigned to the QA team's lead or a shared "QA Triage" user.
Team Notification: An automated message is sent to a specific Slack or MS Teams channel with key info: "Hey @qa-team, JIRA-123 'Implement New User Login Flow' is now ready for testing. Deployed to Staging by @developer-dave."
Artifact Verification: Set a rule that blocks the handoff if a required file, like "test-plan.pdf," isn't attached, prompting the developer to upload it.
This automated sequence ensures a perfect, information-rich handoff every time. The QA team gets a clear signal, the right person is assigned, and all context arrives instantly. This is how top teams use Jira to orchestrate their entire release process.
Managing Deployments Across Multiple Environments
After locking down your quality gates, the next step is managing deployments across environments like dev, staging, and production. A single, linear Jira workflow for this is inefficient and confusing.
Instead, treat each environment as a distinct stage inside the Jira issue itself. This gives you a clear, auditable trail and lets you build specific checks for each environment. A Jira issue transforms from a task tracker into a deployment command center for that specific feature.
Structuring Your Issue for Multi-Environment Promotions
Use nested checklists to map out the deployment process for each environment. For a new user profile feature, create separate sections for each stage in the pipeline.
With a tool like Nesty, you can set up parent checklist items for each environment—like "Deploy to Development," "Promote to Staging," and "Release to Production"—and nest the required tasks underneath each one.
This flow creates a quality-gated handoff, where one stage is fully verified before the next one begins.
This process ensures development work is complete before QA is notified. QA's approval then acts as the final gate, creating a reliable and easy-to-follow handoff.
Here’s a practical structure to implement inside a Jira ticket:
Deploy to Development
Merge feature branch to develop
CI build successful
Smoke tests passed on dev server
Promote to Staging
Create release branch from develop
Deploy to staging environment
Run integration test suite
QA sign-off received
Release to Production
Merge release branch to main
Tag final release version (e.g., v2.5.1)
Production deployment complete
Monitor logs and performance metrics for 30 mins
This structured format makes the status instantly clear. Anyone can see which environment the code is in and what needs to happen next.
Pro Tip: By structuring your deployment process this way, you create a perfect audit trail. When a stakeholder asks about the release process for JIRA-456, you can show them the completed checklist with every step documented and timestamped.
Using Smart Triggers to Automate the Promotion Process
Structure is the start; automation is the accelerator. Use smart triggers to automate the handoffs between environments, eliminating the manual errors that cause delays.
Tie checklist completions to automated Jira actions. Here is a typical Staging-to-Production promotion automation:
The Trigger: The last item on the "Promote to Staging" checklist—"QA sign-off received"—is checked off.
The Automated Cascade:
Task Creation: An automation rule instantly creates a new sub-task titled "Deploy JIRA-456 to Production" and assigns it to the release engineering team.
Stakeholder Notification: A webhook sends a message to the #releases Slack channel and an email to key product stakeholders: "Feature 'JIRA-456' has passed QA on Staging and is now ready for production release."
Issue Status Update: The parent Jira issue's status automatically flips from "In QA" to "Ready for Release," keeping your board accurate.
This automated sequence acts as an invisible project manager, ensuring the right people are notified and the right tasks are created at the right moment. By combining structured checklists with smart automation, you build a resilient, repeatable, and transparent deployment workflow.
Hooking Up Your CI/CD Tools and Automating Release Notes
To achieve full efficiency, connect Jira to your entire development toolchain. Manually updating tickets after a build or deployment is a time-waster and an error source. Integrating Jira with your CI/CD pipeline creates an automated feedback loop that keeps your project board perfectly in sync with your code.
This closes the gap between your codebase and your project plan. When a developer merges a pull request, your CI/CD tool—whether it's Jenkins, GitLab CI, or Bitbucket Pipelines—should update Jira automatically.
Bridging the Gap Between Code and Jira
Use webhooks to connect your CI/CD server to Jira. A webhook is a notification that one system sends another when an event occurs. For example, when a Jenkins build succeeds, it can fire a webhook to a Jira automation rule.
This simple connection unlocks powerful automations. Configure Jira to listen for these signals and react instantly:
Successful Build: A webhook triggers an automation to move the corresponding Jira issue from "In Progress" to "Ready for QA."
Failed Build: A failed build posts an automated comment on the ticket, tagging the developer with a direct link to the build log.
Deployment to Staging: A successful deployment changes the issue's status to "In Staging" and assigns it to the lead QA engineer.
This automation ensures your Jira board is always an accurate snapshot of reality. To learn more about building these rules, our guide on Jira workflow automation provides practical examples.
Taking the Pain Out of Release Notes
The next big win is automating release notes. Compiling them is tedious and error-prone. You can automate this process since Jira already knows every issue—feature, bug fix, and improvement—associated with a specific Version.
Make release notes a natural byproduct of your development process, not a painful task at the end. When Jira generates the first draft, you only need to edit and refine, saving hours of work.
How to Set Up Release Note Generation
Many marketplace apps can do this, but you can also use Jira's native automation. Create a rule that triggers the moment you mark a Version as "Released."
Here’s how to build the automation:
The Trigger: The rule fires as soon as a Jira Version's status is changed to "Released."
The JQL: The automation runs a JQL (Jira Query Language) query to pull all issues with that specific "Fix Version."
Formatting and Sending: It loops through those issues, grabs key details like the summary and issue type, and formats them into a clean list. This text can then be posted to a Confluence page, emailed to stakeholders, or pushed to a Slack channel.
You can also use different templates, such as grouping bug fixes under a "Bug Fixes" heading and new features under "What's New?". This simple setup ensures nothing gets missed and frees your team from one of the most monotonous parts of the release cycle.
Future-Proofing Your Release Process
A great Jira software release management system requires ongoing maintenance to remain effective. Treat it as a living part of your team's toolkit, not a "set it and forget it" project. You need to build a process that is not just efficient today but resilient for the future.
Why Long Term Support Matters
One of the most strategic actions you can take is to stick with Atlassian's Long Term Support (LTS) releases. An LTS version guarantees crucial security, stability, and performance fixes for an extended period, providing a stable foundation.
By opting for an LTS release, you avoid the churn of frequent feature updates. This allows you to refine complex workflows and automations without the platform changing underneath you. This predictability is critical for teams that cannot afford downtime.
For instance, Atlassian designated Jira Software 11.3 as an LTS release, guaranteeing critical bug fixes until December 3, 2027. Over 80% of Fortune 500 companies use Jira, and relying on LTS versions is a core part of maintaining enterprise-grade reliability. As their release notes highlight, this stability minimizes disruptions.
Choosing an LTS release isn’t about missing new features. It’s a deliberate choice for stability, giving your team a predictable environment to perfect their release process.
Future-proofing your Jira setup means building on solid ground. An LTS version combined with well-designed internal processes creates a release machine that is efficient now and dependable for years. To ensure your workflows are built to last, review our guide on Jira workflow best practices.
Even with the best plans, you'll encounter challenges. Here are practical solutions to common questions.
How Do We Handle Dependencies Between Teams?
This is a common headache. When one team is waiting on another, your release timeline is at risk.
The simplest native solution in Jira is the "Blocks" issue link. If ticket PROJ-123 can't proceed until CORE-456 is done, link them. This provides basic visibility.
For a more powerful approach, use an app from the Atlassian Marketplace that offers cross-project release boards. These tools provide a bird's-eye view, automatically flagging schedule conflicts and dependencies that are holding up a release.
What’s the Best Way to Manage Urgent Hotfixes?
When a critical bug hits production, you need to deploy a fix immediately. Your standard workflow is too slow.
The solution is to create a separate, fast-track workflow.
First, create a unique issue type like "Hotfix" to signal its urgency.
Next, design an expedited workflow for it. This process should have fewer statuses and quality gates, stripping it down to the essentials needed for a safe production deployment.
Use Jira's automation to automatically escalate hotfix issues, notify the on-call engineer in Slack, and feature them prominently on dashboards so they cannot be missed.
Can We Sync Our Release Versions with the Service Desk?
Yes, and you should. When a customer reports a bug through Jira Service Management, the support team needs to know when the fix is released.
"Versions" can be shared across multiple projects in the same Jira instance. Link a customer's support ticket directly to the software version that will contain the fix. Once that version is marked as "Released" in Jira Software, trigger an automation rule to update the service desk ticket and notify the customer. This closes the loop between your development and support teams.
Transform your Jira issues into dynamic, automated workflows with Harmonize Pro. Enforce quality gates, automate handoffs, and manage complex processes with Nesty's powerful nested checklists. Get started at https://harmonizepro.com/nesty.
In today's fast-paced software development environment, a chaotic release process is a direct path to production failures, team burnout, and missed deadlines. The difference between a smooth, predictable deployment and a stressful, all-hands-on-deck emergency often comes down to the underlying process. Adopting modern release management best practices is no longer a luxury, it's a necessity for teams aiming to deliver high-quality software reliably and efficiently.
This article moves beyond generic advice to provide a prioritized, actionable collection of 10 best practices tailored for software teams using Jira. We will explore concrete strategies for everything from automated gating and environment promotion to rollback safety and stakeholder communication. Each section is designed to give you a clear roadmap for improving your release pipeline.
You will learn not just what to do, but how to implement these practices. We will provide specific examples and implementation tips, showing you how to turn theory into automated, repeatable workflows that drive real results. Whether you are a release engineer, a product manager, or part of a development team, these insights will help you establish a more resilient, predictable, and efficient release management system. This guide is your blueprint for transforming release cycles from a source of anxiety into a well-orchestrated, strategic advantage.
1. Solidify Gating with a Bulletproof Definition of Ready/Done
Ambiguity is the silent killer of efficient software delivery. One of the most impactful release management best practices is to eliminate this ambiguity at the start and end of the development cycle with a rigorous Definition of Ready (DoR) and Definition of Done (DoD). These aren't just conceptual agreements; they are enforceable quality gates that ensure work only proceeds when it meets specific, predefined criteria.
A strong DoR prevents developers from starting work on ill-defined tasks, a primary source of rework. A robust DoD ensures that what’s handed off to QA or operations meets a consistent quality standard, preventing a cascade of defects downstream.
Implementing DoR and DoD in Jira
To make these definitions effective, integrate them directly into your workflow so compliance becomes automatic, not a manual checklist item.
Definition of Ready (DoR): This gate ensures an issue is fully prepared for development. Before a ticket can be moved to an "In Progress" status, automate checks for conditions like:
Story points are estimated and assigned.
Acceptance criteria are clearly defined in a specific field.
All necessary design mockups or technical specifications are attached.
The issue is linked to a parent Epic.
Definition of Done (DoD): This gate confirms an issue is truly complete before it moves to the next stage (e.g., "In QA" or "Ready for Release"). Your workflow should validate that:
The associated pull request has been merged.
Unit and integration test coverage meets a minimum threshold.
Documentation has been updated (e.g., a linked Confluence page is edited).
The feature has been successfully deployed and verified in a staging environment.
Actionable Tip: Use a tool like Harmonize Pro to create automated workflow validators in Jira. Configure these gates to physically prevent a user from transitioning an issue if its DoR or DoD criteria are not met, displaying a clear message explaining what’s missing. This transforms your process from a suggestion into an enforceable, consistent standard that strengthens your entire release pipeline.
2. Adopt Semantic Versioning for Predictable Releases
Inconsistent versioning creates confusion and risk. Adopting Semantic Versioning (SemVer) is a core release management best practice that replaces ambiguity with a clear, communicative standard. It establishes a shared language for the scope and impact of changes, making dependency management predictable and safe.
The SemVer specification uses a simple MAJOR.MINOR.PATCH format. Each number carries a specific meaning: a MAJOR version signals incompatible API changes, a MINOR version adds functionality in a backward-compatible manner, and a PATCH version introduces backward-compatible bug fixes. This structure immediately tells stakeholders whether an upgrade will require significant development effort or is a low-risk patch.
Implementing Semantic Versioning in Your Workflow
Integrate SemVer into your CI/CD pipeline to make versioning an automated reflection of your code's evolution.
MAJOR (e.g., 2.0.0): Reserved for breaking changes. This could be removing an API endpoint, changing a function signature, or altering expected behavior. A MAJOR release signals to users that they will need to modify their own code to upgrade.
Example: A microservice changes a core API endpoint from /v1/users to /v2/users, breaking all existing integrations.
MINOR (e.g., 1.2.0): Used for adding new, backward-compatible features. Users can adopt this version without fear of their existing implementation breaking.
Example: A new, optional field is added to an API response, or a new, non-breaking endpoint is introduced.
PATCH (e.g., 1.1.2): Intended for backward-compatible bug fixes. This is the safest upgrade, as it only corrects existing, unintended behavior.
Example: A calculation error is fixed, or a security vulnerability is patched without altering any features.
Actionable Tip: Automate version bumping as part of your CI/CD pipeline. Use tools that analyze commit messages (following conventions like Conventional Commits) to automatically determine if a change is a fix (PATCH), a feature (MINOR), or a breaking change (MAJOR). Configure your pipeline to fail the build if a commit message lacks the proper format. This removes human error and ensures your version number accurately reflects the code changes within the release.
3. Automate and Standardize Release Notes and Documentation
A release is only as good as its communication. Neglecting to clearly document what has changed creates a knowledge gap that impacts everyone. One of the most critical release management best practices is to treat documentation as an integrated, automated part of the delivery pipeline, ensuring transparency and reducing post-release friction.
Comprehensive release notes explain what's new, fixed, or deprecated, giving stakeholders clear insight into the value delivered. This practice builds trust, helps users adopt new features, and significantly reduces the burden on your support and customer success teams by preemptively answering common questions.
Automating Documentation in Jira
Generate documentation directly from the work being done in Jira. This removes the manual toil and risk of human error associated with compiling notes at the last minute.
Step 1: Standardize Issue Data: Enforce that all development tickets have a user-facing "Summary" field and are correctly categorized with labels (e.g., bug-fix, new-feature, security-patch).
Step 2: Automate Compilation: Set up a script or workflow that, upon a version release in Jira, queries all associated issues. The script should group issues by their labels.
Step 3: Generate Different Views: Use templates to format the compiled data for different audiences:
Technical View: Include issue keys, summaries, and links to pull requests for the development team.
Business-Friendly View: Exclude technical jargon and focus on the user-facing summaries, grouped by "New Features" and "Bug Fixes."
Support Team Summary: Add a section for potential user impact or required troubleshooting steps.
Actionable Tip: Use Harmonize Pro to create automated post-release workflows that generate and distribute release notes. You can configure a rule that triggers upon a version release in Jira, automatically gathering all associated issues, formatting them according to a predefined template (e.g., separating "Bug Fixes" from "New Features"), and then posting the formatted notes directly to a Confluence page or a Slack channel. This ensures documentation is always timely, accurate, and consistently formatted.
4. Feature Flags and Progressive Rollouts
Decoupling deployment from release is one of the most powerful strategies in modern software delivery. A core component of any robust release management best practices is the use of feature flags and progressive rollouts. This approach allows teams to deploy code into production without making the features visible to all users, fundamentally reducing the risk of a "big bang" release.
Feature flags act as dynamic on/off switches for functionality. Progressive rollouts, like canary releases, leverage these flags to expose new features to a small subset of users gradually. This controlled exposure allows you to monitor performance, gather feedback, and validate stability before a full-scale launch.
Implementing Feature Flags and Progressive Rollouts
Make releases a non-event by testing new code with live production traffic under controlled conditions.
Step 1: Wrap New Code in a Flag: Before merging, ensure all new functionality is enclosed within a feature flag, which is disabled by default in production.
Step 2: Define a Rollout Plan: For each feature, create a simple rollout plan. Start by enabling the flag for an internal test group, then expand to 1% of users.
Step 3: Monitor and Scale: Before increasing the rollout percentage (e.g., to 10%, 50%), check a predefined dashboard for negative signals like increased error rates or latency. If any metric degrades, immediately disable the flag.
Step 4: Automate Cleanup: Once a feature is 100% rolled out and stable for a set period (e.g., two weeks), trigger a process to remove the old flag from the codebase to reduce technical debt.
Actionable Tip: Connect your feature flag status directly to your Jira issues. Use Harmonize Pro to create a "Feature Flag Status" custom field. Then, configure workflow automations that transition the Jira ticket (e.g., to "Ready for Cleanup") once your feature flag management tool (like LaunchDarkly or Split.io) reports the flag has been at 100% rollout for a set period. This automates the flag lifecycle management process and prevents technical debt from accumulating.
5. Achieve Consistency with Environment Parity and Infrastructure as Code
The notorious "it worked on my machine" problem is a direct symptom of inconsistent environments. A critical release management best practice is to actively pursue environment parity: ensuring your development, staging, and production environments are as identical as possible. This systematically eliminates a whole class of release-day surprises.
Achieving this parity manually is nearly impossible. Infrastructure as Code (IaC), using tools like Terraform or AWS CloudFormation, is essential. By defining your infrastructure through code, you make your environments reproducible, version-controlled, and auditable.
Implementing IaC for Predictable Releases
Move from manually configured servers to automated, version-controlled environment definitions.
Step 1: Containerize Your Application: Use Docker to package your application and its dependencies into a single, portable container. This is the first and most critical step toward consistency.
Step 2: Define Infrastructure in Code: Write Terraform or CloudFormation scripts to define your entire environment, including networking rules, load balancers, and database configurations. Store this code in a Git repository.
Step 3: Automate Environment Creation: Integrate your IaC scripts into your CI/CD pipeline. Configure the pipeline to automatically spin up a fresh, production-identical environment for every pull request to run integration tests.
Step 4: Manage Secrets Securely: Do not hardcode secrets like API keys or database passwords. Use a secrets manager (like AWS Secrets Manager or HashiCorp Vault) and inject these values into the environment at runtime.
Actionable Tip: Store your Infrastructure as Code (e.g., Terraform or CloudFormation files) in the same Git repository as your application code, or a closely linked one. Create a dedicated Jira issue type, like "Infra Change," to track and manage modifications to your environments. Use a Harmonize Pro workflow to enforce that any "Infra Change" issue requires peer review and successful execution in a staging environment before it can be approved for production deployment. This brings visibility and governance to infrastructure changes, treating them with the same care as application code changes.
6. Release Planning and Schedule Adherence
Unpredictable releases create chaos for stakeholders and erode trust. A foundational release management best practice is to establish and adhere to a structured release plan and schedule. This moves teams from a reactive, "it's done when it's done" model to a proactive, predictable cadence that aligns the entire organization.
A well-defined schedule sets clear expectations for feature scope, quality criteria, and communication timelines. A predictable rhythm allows marketing, sales, and support teams to plan their own activities effectively, preventing last-minute scrambles.
Implementing a Release Cadence in Jira
Make the timeline transparent and the deadlines non-negotiable by building them into your tools.
Establish a Release Calendar: Create a shared, visible calendar in Confluence or Google Calendar that outlines all key dates for the next quarter. This includes not just the final release date but also critical milestones like feature freeze and code freeze.
Define and Enforce Freeze Periods:
Feature Freeze: One week before the planned release, no new feature tickets can be added to the release version in Jira. The focus shifts entirely to bug fixing and stabilization.
Code Freeze: 48 hours before release, only merges related to critical, release-blocking bugs are permitted. This minimizes the risk of introducing last-minute regressions.
Actionable Tip: Use Jira's Fix Versions to manage scope and track progress against your release schedule. You can create dashboards that show the status of all issues slated for a specific version. For process enforcement, use Harmonize Pro to create workflow validators that prevent issues from being added to a release after the feature freeze date has passed, automatically enforcing your established timeline and protecting release integrity.
This structured approach, which you can learn more about through various best practices in Jira, balances the need for agility with the predictability required by the business.
7. Institute Robust Rollback and Disaster Recovery Plans
Even with the best testing, things can go wrong in production. A critical component of modern release management best practices is planning for failure. Having a robust, tested, and rapid rollback strategy is what separates mature engineering organizations from those who simply hope for the best. The goal is to minimize the mean time to recovery (MTTR) and protect the end-user experience.
A well-rehearsed plan ensures that a failed deployment is a minor incident, not a catastrophic outage.
Implementing Proactive Recovery Strategies
Make recovery procedures automated and predictable.
Step 1: Define Rollback Triggers: In your monitoring tool, define specific alert conditions that will trigger a rollback (e.g., API error rate exceeds 5% for 5 minutes, p99 latency doubles).
Step 2: Automate the Rollback: Create a one-click rollback script or pipeline job that redeploys the previous stable version of the application. Ensure this process is automated and does not require manual SSH access.
Step 3: Conduct Regular DR Drills: Schedule quarterly "game days" where you intentionally simulate a failure in the staging environment (e.g., delete a database, take down a service) and execute your recovery plan. Document the time it takes to recover and identify areas for improvement.
Step 4: Plan for Data Migrations: For releases involving database schema changes, have a tested script ready to revert the migration or a forward-fix script to correct data issues without data loss.
Actionable Tip: Use your Jira workflow to manage incident response. Create a dedicated "Incident" issue type with a predefined workflow that guides the team through diagnosis, escalation, rollback execution, and post-mortem analysis. Link these incident tickets directly to the release tickets in Harmonize Pro to create a clear audit trail, making it easy to identify which release caused the issue and ensuring the post-mortem action items are tracked to completion.
8. Formalize Change Management and Communication
A technically perfect release can still fail if it surprises stakeholders. A critical release management best practice is implementing a formal change management and communication process. This framework ensures that every release is documented, approved, and clearly communicated.
Effective change management involves a structured process for evaluating the impact of changes, securing necessary approvals, and notifying all affected parties with the right information at the right time.
Implementing Change Communication in Jira
Integrate your communication plan directly into your release workflow to ensure no step is missed.
Pre-Release Communication Checklist: Before deployment, your release ticket must confirm that:
The Change Request (CR) is documented with a risk and impact analysis.
Approvals from key stakeholders (e.g., Head of Product, QA Lead) are recorded on the Jira ticket.
A pre-release notification has been sent to an internal eng-release-updates Slack channel.
The customer-facing release notes have been drafted and linked in Confluence.
In-Flight & Post-Release Communication:
Automate messages to the Slack channel for "Deployment Started," "Deployment Successful," and "Rollback Initiated."
Update a central status page (like Statuspage.io) in real-time during the deployment.
After a successful release, automatically send an email to the customer success team with a link to the finalized release notes.
Actionable Tip: Automate your stakeholder notifications using post-functions in your Jira release workflow. For instance, when a "Release" issue is transitioned to "In Progress," a post-function can automatically send a templated email to a stakeholder distribution list and post a message in a dedicated Slack channel. This ensures timely, consistent communication without manual effort. Learn more about how to best manage these kinds of Jira workflow changes to support your processes.
9. Monitoring, Observability, and Metrics-Driven Releases
Deploying software without a robust monitoring strategy is like flying blind. A critical release management best practice is embedding deep monitoring and observability into your process. This means creating a rich, data-driven view of your system's performance, health, and user impact before, during, and after a release.
This proactive approach allows teams to detect anomalies instantly, understand the real-world impact of their changes, and make informed decisions about whether to proceed, pause, or roll back a deployment.
Implementing Metrics-Driven Releases
Tie monitoring data directly to your release process to measure every deployment against clear success criteria.
Step 1: Create a Release Dashboard: Before each release, create a temporary or version-specific dashboard in your monitoring tool (e.g., Datadog, Grafana) that consolidates all key metrics. This should include:
Technical Metrics: Application error rates (e.g., 4xx, 5xx), API latency (p95, p99), and container CPU/memory usage.
Business Metrics: User sign-ups per minute, conversion rates, or items added to cart.
SLO/SLI: A chart showing your performance against your Service Level Objectives.
Step 2: Establish a Baseline: One hour before release, take a snapshot of the dashboard metrics to establish a clear "before" state.
Step 3: Monitor During and After Release: During the deployment and for at least one hour afterward, the release team should actively watch this dashboard. Compare the live metrics against the baseline to spot deviations immediately.
Step 4: Set Automated Alerts: Configure alerts to automatically notify the on-call team if any key metric breaches a predefined threshold (e.g., "5xx error rate > 2% for 3 minutes").
Actionable Tip: Connect your monitoring platform's alerts to your Jira workflow. Using a tool like Harmonize Pro, you can configure an automation that automatically creates a high-priority "Incident" or "Bug" issue in Jira when a critical alert is triggered post-release. This rule can pre-populate the ticket with alert details and assign it to the on-call engineer, bridging the gap between observability and incident response and ensuring nothing falls through the cracks.
10. Release Coordination and Cross-functional Collaboration
Software delivery is a team sport, yet many organizations operate in functional silos. A critical release management best practice is to actively engineer cross-functional collaboration. This means creating a system where development, QA, operations, and product management work as a unified force toward a shared release goal.
A well-coordinated release process ensures everyone understands their role, dependencies are managed proactively, and the entire team shares ownership of the outcome.
Implementing a Collaborative Release Framework
Embed communication and shared responsibility directly into your release cadence.
Step 1: Appoint a Release Lead: For each release, designate one person as the Release Lead. This person is not responsible for doing all the work but for coordinating activities, running meetings, and being the single point of contact for status updates.
Step 2: Define Roles with a RACI Matrix: Create a simple RACI (Responsible, Accountable, Consulted, Informed) chart in Confluence for key release activities. For example:
Go/No-Go Decision: Accountable: Release Lead. Consulted: QA Lead, Eng Lead.
Run Deployment Script: Responsible: On-call SRE. Informed: All.
Step 3: Run Cadenced Meetings:
Release Kickoff (Pre-release): A 30-minute meeting to review the release scope and confirm the timeline.
Go/No-Go Check-in (1 hour before release): A 15-minute sync to confirm all systems are ready.
Retrospective (Post-release): A 45-minute meeting to discuss what went well, what didn't, and create actionable improvement tickets in Jira.
Actionable Tip: Formalize your release process within Jira by creating a dedicated "Release" issue type. Use a tool like Harmonize Pro to build a workflow that automates stakeholder notifications and enforces sign-offs. For example, you can configure a status transition that automatically alerts the Product, QA, and Ops leads via Slack and requires their formal approval on the Jira ticket before the release can proceed to the "Ready for Deployment" stage.
10-Point Release Management Best Practices Comparison
Practice
🔄 Implementation complexity
⚡ Resource requirements
📊 Expected outcomes
⭐ Ideal use cases
💡 Key advantages / Tips
Automated Testing and Continuous Integration
High — CI pipelines + test suite maintenance
High — CI runners, test infra, developer time
📊 High — early bug detection, faster feedback, fewer regressions
⭐ Frequent deploys, large codebases, teams seeking reliability
Release Coordination and Cross-functional Collaboration
Medium — roles, meetings, shared processes
Medium — shared tools, coordination time
📊 Medium — smoother releases, faster issue resolution, better alignment
⭐ Cross-functional teams, large or distributed orgs
💡 Assign a release manager, use RACI, share status via common platforms
Turn Best Practices into Your Daily Workflow
Navigating the complexities of modern software delivery requires more than just good intentions; it demands a structured, strategic approach. Throughout this guide, we've explored ten critical release management best practices, moving from high-level concepts to tangible, in-the-weeds actions your team can take. We've seen how integrating automated testing and CI/CD pipelines forms the bedrock of a reliable process, and how semantic versioning brings clarity and predictability to your release cadence. The journey doesn't stop there; it extends to crafting meticulous release notes, leveraging the power of feature flags for progressive rollouts, and ensuring environment parity through Infrastructure as Code.
The core message is clear: transforming your release process from a source of anxiety into a competitive advantage is an achievable goal. It’s about shifting from a reactive stance, where teams scramble to fix post-deployment issues, to a proactive one built on foresight and control. This means embracing robust rollback plans, instituting clear change management protocols, and fostering a culture of transparent communication across all functions. Each practice, from release planning to cross-functional collaboration, serves as a pillar supporting a more resilient, efficient, and predictable delivery pipeline.
From Theory to Tangible Results
Adopting these release management best practices is not an all-or-nothing proposition. The key is to start small, identify your most significant pain point, and apply a targeted solution.
Is communication a bottleneck? Start by formalizing your change management and communication plan (Practice #8). Implement a clear sign-off process within Jira for key stakeholders before a release candidate is promoted.
Are post-release bugs causing chaos? Double down on your rollback and disaster recovery planning (Practice #7) and enhance your monitoring and observability stack (Practice #9) to catch anomalies faster.
Do deployments feel inconsistent? Focus on achieving environment parity with Infrastructure as Code (Practice #5) to eliminate the "it worked on my machine" problem once and for all.
The true value of these practices is realized when they become ingrained in your team's daily workflow, not just a checklist consulted before a major launch. This is where tooling becomes a powerful ally. By embedding these processes directly into your project management environment, like Jira, you lower the barrier to adoption and make the "right way" the easiest way. For instance, creating automated workflows that enforce a Definition of Done before a ticket can move from "In QA" to "Ready for Release" turns a best practice into an unavoidable, everyday reality. This systematic approach cultivates a culture of quality and accountability, where every team member understands their role in safeguarding the release pipeline.
The Strategic Value of a Mastered Release Process
Ultimately, mastering these concepts elevates your release process from a simple operational task to a strategic business function. A well-oiled release machine directly impacts customer satisfaction, developer morale, and the bottom line. Predictable, high-quality releases build trust with your users and allow your product and marketing teams to plan campaigns with confidence. Internally, a low-stress, automated process frees up your engineering talent to focus on innovation and building value, rather than fighting fires and managing manual deployment steps.
By methodically implementing these release management best practices, you are not just shipping code; you are building a resilient, scalable, and reliable delivery engine. You are creating a system that supports growth, mitigates risk, and empowers your entire organization to move faster and more confidently. The path forward is one of continuous improvement, where each release becomes an opportunity to refine your process, learn from data, and deliver even greater value. Your journey toward a world-class release management process starts with the next commit, the next build, and the next deliberate step you take to turn these best practices into your standard operating procedure.
Ready to move beyond manual checklists and embed these best practices directly into your Jira workflow? Discover how Harmonize Pro can help you automate release gating, streamline environment promotion, and build a fully orchestrated release pipeline. See how our Nesty workflow engine can turn your release management strategy into an automated reality at Harmonize Pro.
Think of process orchestration as the central brain that directs every moving part of a business operation—your apps, your teams, and your systems—making sure they all work together in perfect sync. It's the practical blueprint for turning siloed efforts into a coordinated, efficient performance, like onboarding a new customer without a single hiccup.
Unlocking Efficiency: What Is Process Orchestration?
Imagine your business is a world-class orchestra. Each department, software tool, and team member is a musician, an expert on their own instrument. Your sales team has their CRM, finance has its ERP, and developers live in their project management software. If you just let them do their own thing, they might play beautifully, but they won't create a symphony. They'll just make a lot of noise.
This is where process orchestration steps in to act as the conductor. It provides the actionable plan for a complete business process, like "new employee onboarding" or "order fulfillment." Instead of relying on a flurry of manual emails or endless status meetings, orchestration gives each "musician" precise instructions on when to play their part, in what order, and with what information.
The Conductor in Action
So, how does this conductor deliver results? Its main job is to coordinate a sequence of tasks that jump across multiple, often disconnected, systems and even involve different people.
For example, the moment a sales deal is marked "Closed-Won" in Salesforce, an orchestration engine can immediately execute a series of actions:
It creates a new invoice in your accounting software, pulling the correct amount and customer details.
It provisions a user account in your product's backend system, granting the right access levels.
It assigns a task to an onboarding specialist in Jira to schedule a kickoff call, with the customer's contact info already attached.
It triggers a personalized welcome email to the new customer from your marketing platform.
Individually, each of these is a simple task that could be part of a basic workflow. The orchestration is what ties them all together into one seamless, end-to-end process. This approach is worlds apart from simple task automation. You can get a deeper look at the difference in our guide on what is workflow automation versus orchestration. The key takeaway is that orchestration manages the entire journey, not just one leg of the trip.
An orchestrated process ensures that even the most complex series of steps are executed correctly across all endpoints. The actionable result is that customers, suppliers, partners, and employees have a smooth experience when they interact with or are affected by processes.
This kind of central control is essential for any modern business. Without it, you end up with "islands of automation"—pockets of efficiency floating in a sea of messy, inefficient, and error-prone processes. Orchestration is what builds the bridges between those islands.
Core Functions of Process Orchestration at a Glance
To make this concept more concrete, let's look at a quick summary of what process orchestration actually does to streamline business operations and how it makes a real difference.
Function
What It Means in Practice
Actionable Insight
Centralized Control
A single engine manages and monitors the entire end-to-end process flow.
Gain full visibility into process status, spot bottlenecks before they cause delays, and clarify accountability.
System Integration
Connects different applications (e.g., CRM, ERP, HRIS) via APIs to pass data.
Eliminate data silos, stop manual data entry errors, and ensure information is consistent everywhere.
Task Sequencing
Defines the precise order of operations, including dependencies and conditions.
Prevent missed steps, enforce compliance automatically, and guarantee processes run exactly as designed, every time.
Error Handling
Automatically manages exceptions, retries failed tasks, or alerts a human to step in.
Build more resilient processes that minimize downtime and keep the business running smoothly, even when things go wrong.
Ultimately, these core functions work together to create a system that's not just automated, but truly intelligent and coordinated.
Orchestration vs Choreography vs Automation
To really get a handle on process orchestration, it’s helpful to put it side-by-side with two other terms that often get tossed around: choreography and automation. People frequently use them interchangeably, but they describe very different ways of getting work done. Picking the wrong approach for your specific business problem can lead to a lot of headaches down the road.
Let's break it down with an analogy.
Orchestration is like a symphony orchestra led by a conductor. The conductor has the full musical score and directs each musician—when to play, how loudly, and what part. Everything is centrally controlled and coordinated.
Choreography is more like a flash mob. Each dancer knows the overall routine but takes their cues from the dancers around them. There's no single person in charge directing every move; the group self-organizes to create the performance. Control is completely decentralized.
Automation, on the other hand, is like a metronome. It performs one specific, repetitive task perfectly every time it's switched on. It's incredibly useful for its one job but has no awareness of the larger performance.
A Deeper Look at the Differences
The real difference comes down to control and communication. Process orchestration uses a central controller (the orchestration engine) to manage a workflow from start to finish. This "conductor" knows every step, juggles dependencies between different systems, and gracefully handles any errors that pop up.
Choreography, in contrast, runs on an event-driven model. When one service finishes its job, it simply announces it by publishing an event. Other services are listening for these events and react when they hear one that's relevant to them. It’s a distributed system that offers a ton of flexibility, but it can be a nightmare to monitor and troubleshoot when things go wrong because there's no single source of truth.
Task automation is much simpler. It’s all about making a single, isolated task run on its own. Think of a rule that automatically creates a calendar invite from an email. It’s great for boosting individual productivity but isn’t designed to connect multiple, complex systems to run a larger business process.
The market is clearly moving in this direction. The process orchestration market was valued at USD 8.4 billion and is expected to grow at an 18.1% CAGR through 2034. This isn’t just a buzzword; it reflects a major shift away from simple task automation toward more robust, centrally managed systems. You can find more on this trend in a market report from Global Market Insights.
This diagram perfectly illustrates how process orchestration acts as a central hub.
As you can see, the conductor sits right in the middle, directing the flow of work between different apps, teams, and systems—a clear visual of that centralized control.
Orchestration vs Choreography vs Automation
To make the distinctions crystal clear, here’s a quick side-by-side comparison to help you decide which tool fits your needs.
Attribute
Process Orchestration
Process Choreography
Task Automation
Control Model
Centralized (a "conductor" directs all services)
Decentralized (services react to events independently)
Localized (a trigger initiates a single, pre-defined task)
Communication
Point-to-point commands from the orchestrator
Event-driven broadcast model
Simple trigger-action mechanism
Coupling
Tightly coupled to the orchestrator
Loosely coupled services
Tightly coupled within its specific task
Visibility
High; easy to monitor the end-to-end process
Low; harder to track the overall state and debug
High for the single task, but no process-level view
Best For
Complex, stateful, multi-step business processes
Scalable, independent microservices and systems
Simple, repetitive, high-volume individual tasks
Example
Onboarding a new employee (HR, IT, and Finance systems)
An e-commerce order (triggers inventory, shipping, email)
Automatically forwarding an email with a specific subject line
This table should help you quickly identify which approach best fits the challenge you're trying to solve.
When to Use Each Approach
So, which one is right for you? It all comes down to the job at hand. Using the wrong tool can create more problems than it solves.
Use Orchestration for: Long-running, complex processes where you need visibility, robust error handling, and strict compliance. A great example is client onboarding, which involves a precise sequence of steps across your CRM, finance software, and project management tools.
Use Choreography for: Scenarios that demand high scalability and loosely coupled systems, like a microservices architecture. An e-commerce site might use choreography so that an "Order Placed" event independently triggers separate services for shipping, inventory, and notifications.
Use Automation for: Simple, high-volume, and repetitive tasks that live within a single application or domain. Think automatically archiving emails, generating a weekly report from a spreadsheet, or syncing files between two cloud folders.
Once you understand these key differences, you have a solid framework for making smarter technology decisions for your business.
Okay, let's move past the theory. What does process orchestration actually do for a business? The real-world results show up directly on your bottom line and in your ability to adapt quickly. This isn't just about connecting a few apps; it's about fundamentally rewiring how work flows through your organization.
The biggest win comes from getting rid of the friction. Think about how many processes rely on someone manually copying data from one system, pasting it into another, and then firing off an email to the next person. Every single one of those manual steps is a potential point of failure—a delay, a typo, a forgotten task.
Orchestration completely wipes out these manual touchpoints. By automating the entire sequence from start to finish, you can shrink workflows that used to take days into processes that are over in minutes. This frees up your team from the mind-numbing administrative work of just keeping things moving, allowing them to focus on high-value work. The result? You get a whole lot more done with the same number of people.
Finally, Get True Visibility and Control
One of the most powerful things orchestration gives you is a single source of truth for your workflows. Stop digging through scattered emails, Slack threads, and half a dozen different software dashboards just to figure out where a project stands. Instead, get a centralized, end-to-end view of the entire process.
This kind of visibility is a game-changer for any manager or team lead. You can see exactly where work is at any given moment and, more importantly, spot bottlenecks before they completely derail a project.
When you can see the entire workflow laid out, you can start measuring performance against real KPIs, tracking dependencies, and making sure every step follows your business rules. Process management stops being a reactive, firefighting exercise and becomes a strategic, data-driven part of your business.
Let's say your customer onboarding process keeps getting stuck at the "technical setup" stage. An orchestration platform makes that trend impossible to ignore. You can immediately dig in and find out why. Is the team understaffed? Are they missing key information from the sales team? Is there a recurring technical bug? Being able to diagnose and fix these problems on the fly is a massive competitive advantage.
Build a Business That's Ready to Scale
As a company grows, its processes get more complex. It's a natural growing pain. But without a solid system in place, that complexity can quickly lead to chaos. Operations become fragile and can easily collapse under the pressure of more customers, more orders, and more projects.
Process orchestration creates a resilient and scalable backbone for your operations. Because a central engine defines and executes every workflow, you get consistency and repeatability baked right in. This is a practical step for maintaining quality and compliance, even as you scale up. Onboarding new team members becomes way easier, too, because the "right way" to do things is embedded directly into the system they use every day.
This structured approach also makes your business far more adaptable. Need to change a process? You just update the orchestrated workflow in one central place, and that change instantly ripples out to all the connected systems and teams. That kind of agility is crucial for jumping on new market opportunities or keeping up with changing regulations.
Ultimately, orchestration gives you the operational framework to handle growth without sacrificing speed, quality, or control. Your processes transform from a potential liability into a strategic asset that fuels your expansion.
How to Implement Process Orchestration Step by Step
Jumping into process orchestration can feel like a massive project, but you don't have to boil the ocean. The secret is to start small, prove the value with a quick win, and then build on that momentum. Think of it less like a giant leap and more like a series of deliberate, well-planned steps. This roadmap will get you from your first idea to a live, automated workflow.
Step 1: Identify and Map Your First Process
First things first, pick your starting point. The sweet spot is a process that's both high-impact and low-complexity. Look for workflows that cause constant headaches—the ones that frequently stall, are riddled with human error, or just burn up too much time with manual work. Those are your prime candidates.
Once you have one in mind, map it out from beginning to end. Don't leave anything out. Take a simple customer return process, for example:
A customer fills out a return request on the website.
A support agent reviews and approves it.
The system automatically generates a shipping label and emails it out.
The warehouse team inspects the item when it arrives.
Finance gets a notification to process the refund.
The inventory count gets updated.
Writing down every action, decision, and system involved creates the blueprint for your automation. Getting this clarity upfront is absolutely essential for a successful project.
Step 2: Select the Right Orchestration Tool
With your process map in hand, it's time to find the right tool for the job. Not all orchestration platforms are built the same, so the best choice really hinges on your team's needs and the software you already use.
Here's what to look for:
Integration Support: Does it have ready-made connectors for your everyday apps like Jira, Salesforce, or Slack? If not, how easy is it to connect to other systems using APIs?
Ease of Use: Is the interface intuitive? A visual, low-code workflow designer is a game-changer because it lets both technical folks and business users build and tweak processes together.
Scalability: Will the tool grow with you? It needs to handle your simple workflow today but also be powerful enough for more complex, high-volume processes down the road without slowing down.
For teams already living in Jira, a tool like Harmonize Pro's Nesty is a great fit because it’s built specifically to orchestrate work inside that ecosystem. You can see how these tools are set up by checking out the Nesty getting started documentation.
Step 3: Design and Build the Workflow
Now for the fun part: turning that map into a real, functioning workflow. In your chosen tool, you'll start dragging and dropping steps, arranging them in sequence, and defining the rules that govern how the process flows.
This is where you connect all the dots. You’ll set up API calls to move data between systems—like grabbing customer details from your CRM to auto-populate a task in your project manager. You’ll also build in conditional logic, like "if the return is approved, then send the shipping label; otherwise, send the customer an email explaining why."
This design phase is where the "conductor" truly gets its sheet music. Every instruction, dependency, and handoff is explicitly defined, ensuring the process runs exactly as intended every single time.
Step 4: Test and Deploy Iteratively
Never roll out a new orchestrated process without putting it through its paces first. Test every possible scenario you can think of, especially the ones where things go wrong. What happens if an API call fails or a critical piece of data is missing? A good workflow needs solid error handling to manage those exceptions without a complete meltdown.
Kick things off with a small pilot program. Let a limited group of users or a small batch of cases run through the new workflow. This gives you a safe space to find bugs, gather feedback, and make adjustments. Once you're confident it's running smoothly, you can open it up to everyone else. This cycle—build, test, learn, repeat—is the fastest way to a successful rollout.
Real-World Use Cases in Finance and E-commerce
Theory is great, but the real magic of process orchestration happens when you see it untangling complex, real-world problems. Let’s look at how it delivers a serious impact in two industries that live and die by their speed, accuracy, and customer experience: finance and e-commerce. These examples show how orchestration turns a spaghetti-like mess of multi-system workflows into a smooth, automated operation.
This isn't just some niche tech. It’s a core part of modern business, especially in data-heavy sectors. In the Banking, Financial Services, and Insurance (BFSI) world, process orchestration already commands over 25% of the global market share. With 65% of these companies wrestling with disconnected workflows, it's no wonder they're turning to orchestration to stitch their systems together. Managers are seeing real results, like 15% efficiency gains in just a few months. You can dig into more data on the process orchestration market at Market Research Future.
Transforming Finance With Orchestrated Loan Processing
If you've ever applied for a loan, you know the process can be painfully slow and manual. It bounces between departments—sales, underwriting, compliance—and involves a whole collection of separate systems for credit checks, ID verification, and fraud detection.
The Challenge: A typical loan application can easily get stuck for weeks. An underwriter waits for a document, only to find it's the wrong one, and the whole thing grinds to a halt. Every single delay increases the odds of a frustrated customer walking away and going to a competitor.
The Orchestrated Solution: An orchestration engine acts as the central conductor for the entire loan approval lifecycle.
Initiation: The moment an application is submitted online, the orchestrator kicks off several workflows at once.
Verification: It makes an API call to a credit bureau for a score while simultaneously hitting another service to verify the applicant's identity against government records.
Decisioning: All that data gets packaged up and routed to an underwriter. If the loan is approved, the orchestrator automatically generates the final documents and sends them out for an e-signature.
Funding: Once the documents are signed, it pings the finance system to release the funds and creates a new account in the core banking platform.
This end-to-end automation does more than just make things faster. It creates a perfect, auditable trail for every single application, which is a massive win when the regulators come knocking.
The chart below from Market Research Future gives you a sense of just how big the market for process orchestration is, highlighting its heavy use across industries like BFSI.
This data shows the serious financial commitment companies are making, with the banking and finance sector leading the way in using orchestration to modernize their operations.
Streamlining E-commerce Order Fulfillment
For any e-commerce business, the moment a customer clicks "buy" is just the start of a pretty complex journey. Getting that order from a warehouse shelf to the customer's front door means coordinating inventory systems, payment gateways, shipping carriers, and customer emails.
The Challenge: One tiny mistake—selling an item that just went out of stock or forgetting to send a shipping notification—can completely sour the customer experience and earn you a one-star review. Without orchestration, these steps are often a patchwork of manual spreadsheet checks and siloed software that don't talk to each other.
The Orchestrated Solution: A process orchestrator can manage the entire fulfillment workflow from a single dashboard, ensuring nothing falls through the cracks.
It first confirms the payment went through successfully.
Then, it checks inventory levels in real-time to reserve the product.
It routes the order details to the correct warehouse management system.
As soon as a shipping label is created, it grabs the tracking number and fires off an email and SMS update to the customer.
Finally, it updates the order status in the customer's account portal so they can check on it themselves.
This kind of tight coordination turns a potentially chaotic scramble into a reliable, efficient, and transparent operation that actually builds customer trust.
The Anatomy of an Orchestration System
To really get what process orchestration is all about, it helps to pop the hood and see what’s inside. These platforms can seem like magic, but they’re actually built on a few core components that work together to bring your workflows to life. Understanding this architecture helps everyone, from business leaders to developers, see how these systems are so resilient and scalable.
At the very center of it all is the orchestration engine. Think of it as the brain or the central nervous system of the entire operation. This is the component that actually executes the workflows you design, keeps track of where every single process is at any given moment, and makes decisions based on the rules you’ve set.
The engine takes your process model—the blueprint for your workflow—and turns it into a living, breathing sequence of actions. It knows exactly which task to run next, what data needs to be passed along, and how to handle any hiccups or errors that pop up. Without a solid engine, you’ve just got a static diagram. With one, you have a dynamic, automated process.
The Orchestration Engine: The Brain of the Operation
This engine does more than just run tasks. It juggles several critical functions that are absolutely essential for managing complex, long-running processes.
State Management: The engine keeps tabs on the current status of every workflow instance. If a process needs to pause for three days to wait for a customer response, the engine remembers exactly where it left off and what needs to happen when it resumes.
Task Execution: It’s responsible for kicking off tasks, whether that means calling an external API, assigning a ticket to a person, or running a piece of internal code.
Error Handling and Retries: When a task fails—maybe a service it relies on is temporarily offline—the engine can automatically retry the task. If that doesn't work, it can trigger a predefined compensation action to undo previous steps, keeping everything clean.
This "brain" is what makes the whole system so reliable. It ensures that even if one small part of the process hits a snag, the entire workflow doesn't come crashing down. That’s the kind of stability modern business operations absolutely demand.
Connectors and APIs: The Bridges to Everywhere
An orchestration engine is pretty useless if it can’t talk to the outside world. That's where connectors and APIs come in. They act as the essential bridges that allow the engine to communicate with all your different applications, databases, and microservices.
Connectors are often pre-built integrations that make it easy to link up with common platforms like Salesforce, Slack, or Jira. APIs (Application Programming Interfaces), on the other hand, provide a universal language for software to communicate, letting the orchestrator send and receive data from just about any modern tool. For example, a trigger can be set up to send a notification when a step is done; you can see a real-world example of this in the documentation on how to configure a trigger notification.
These bridges are what turn a theoretical model into a practical tool. They let you coordinate real work across your entire tech stack, finally breaking down those frustrating silos between different systems.
Design Patterns for Bulletproof Resilience
Finally, modern orchestration systems don't just wing it. They rely on proven design patterns to handle tricky situations with grace. One of the most important patterns you'll hear about is the Saga pattern, which is a clever way to manage transactions that span multiple, separate services.
The Saga pattern is all about maintaining data consistency across different systems without having to lock everything down. If one step in a multi-part process fails, the saga triggers a series of compensating actions that roll back the changes made by the previous steps, putting everything back into a consistent state.
Picture this: you're booking a trip that involves a flight, a hotel, and a rental car. That’s three separate transactions. If the flight and hotel book successfully but the car rental fails, you don't want to be stuck with the first two. The Saga pattern automatically cancels the flight and hotel reservations, ensuring you aren't charged for an incomplete booking. This is the kind of rock-solid, fault-tolerant logic that lets you trust orchestration with your most critical business operations.
A Few Lingering Questions About Process Orchestration
Even after getting a handle on the basics, a few questions tend to pop up. Let's tackle them head-on to clear up any confusion and give you a complete picture of how orchestration works in the real world.
One of the biggest points of confusion is the difference between Business Process Management (BPM) and process orchestration. Think of it like this: BPM is the master blueprint. It’s the strategic discipline of designing, analyzing, and improving how your business gets things done.
Process orchestration, on the other hand, is the engine that brings that blueprint to life. It’s the technical "how" that coordinates all your different systems and services to execute the plan. BPM defines the what and why; orchestration is the tool that makes it happen.
Isn't This Just for Big Companies?
Not anymore. It used to be that only huge corporations with massive budgets could afford this kind of technology. But modern cloud-based and low-code platforms have completely changed the game, putting powerful orchestration tools within reach for small and medium-sized businesses.
An SMB can see a huge impact by starting with just one critical workflow—like automating customer onboarding or invoice processing. This simple step can free up key people and slash costly manual errors, all without needing a giant IT team to run the show. The trick is to start small and let the wins fund your next move.
A common myth is that orchestration has to be a massive, all-or-nothing project. The reality is you can take it one step at a time. Modern tools let you automate one process, prove its value, and use that success to justify the next one.
How Do I Actually Measure the ROI?
You can’t improve what you don’t measure. To prove the value of process orchestration, you need to track clear Key Performance Indicators (KPIs) that are tied directly to the goals you set from the beginning. Don't just automate for automation's sake.
Here are a few metrics that really show the impact:
Reduced Process Cycle Time: How much faster does a task get done from start to finish? For example, did your loan approval time drop from 10 days to 2?
Lower Error Rates: This is a direct measure of improved quality and less time spent on rework. Are you seeing fewer data entry mistakes in customer records?
Direct Cost Savings: How many hours of manual work have you eliminated? Multiply those hours by a blended employee salary to put a dollar figure on it.
Increased Throughput: How many more processes can your team complete in the same amount of time? Can your onboarding team now handle 20 new clients a week instead of 10?
The best orchestration platforms have built-in dashboards that track these KPIs for you. This makes it incredibly easy to show stakeholders the tangible ROI and prove how much more efficient your operations have become.
Turn your complex Jira workflows into efficient, self-managing processes with Harmonize Pro. Our Nesty app transforms static tickets into dynamic, automated workflows that keep teams aligned and deliver results faster. Start streamlining your cross-team collaboration today.